The following document was created by the DEI Working Group in October 2023 in response to the final discussion of the group that participated in the book club which read “97 Things About Ethics Everyone in Data Science Should Know”.
Goals of this document:
Provide a summary of action items suggested during book clubs. The summary is a living document kept on the EFI Book Club webpage and action items will be added from future book clubs. This document is to be used as a reference to support and inspire activities for EFI that can be developed/led as individuals have time, availability, and interest in doing so
Provide an opportunity to collate and celebrate activities that have taken place and those activities that will take place in the future that have been inspired by or align with suggestions from the book clubs.
Note: There was a group within EFI that read Spatio-Temporal Statistics with R. That book group was not led by the DEI working group and was not included in this assessment.
Have we done any of the stuff we planned to do?
From 97 Things About Ethics
Summarize ideas we’ve had in previous book clubs and do self-assessment
This document!
From Braiding Sweetgrass
Gratitude statement regarding data as a gift from the community, posted in:
JEDI (justice, equity, diversity, inclusion) database assessing who is in EFI is a good place to start to contribute to the self-assessment
Dave Klinges (University of Florida) has worked with EFI Community Manager, Jody Peters (University of Notre Dame) to develop a workflow to assess the demographics of EFI members and how that changes through time
From The Years That Matter Most and from Caste
DEI Workshop ideas – webinar series leading up to workshops. Whose voices do we want to hear ahead of time
Culturally competent training
In late 2020/early 2021 the EFI DEI working group hosted 4 panels for the “Conversations on Diversity and Data Seminar Series.” See the links below for the recordings for each panel and the resources shared.
Mentorship networks and having a series of mentors
EFISA co-working session
Developing a mentoring network for minority students is one of the goals of the Alfred P. Sloan Foundation Equitable Pathways funding from the project “A Generation of Native American Earth and Environmental Data Scientists” that EFI is involved with
Still working on developing this, but the idea is for BIPOC students in research to have mentors from their own institution as well as mentors from the institutions they are doing research with and that the mentors will continue to support the students beyond the original activity
From the Years That Matter Most
Train the trainers
This is something that continues to be included in EFI-led proposals. Freya Olsson is also thinking about updating her NEON Forecasting Challenge workshop material which is currently geared towards participants wanting to learn how to submit forecasts to the Challenge to be applicable for people want to teach others how to submit to the Forecasting Challenge
On the October 2023 Education working group call, the group discussed the following two papers. The first is about the needs for instructor training for people teaching data science at the collegiate level. The second provides papers, discussion prompts, and R code materials that can be used or modified for teaching ecological forecasting at the upper undergrad/early grad student level
Melissa Kenney1, Michael Gerst2, Toni Viskari3, Austin Delaney4, Freya Olsson4, Carl Boettiger5, Quinn Thomas4
1University of Minnesota, 2University of Maryland, 3Finnish Meteorological Institute,4Virginia Tech, 5University of California, Berkeley
With the growth of the EFI NEON Ecological Forecasting Challenge, we have outgrown the current Challenge Dashboard, which was designed to accommodate a smaller set of forecasts and synthesis questions. Thus, we have reenvisioned the next stage of the EFI-RCN NEON Forecast Challenge Dashboard in order to facilitate the ability to answer a wider range of questions that forecast challenge users would be interested in exploring.
The main audience for this dashboard are NEON forecasters, EFI, Forecast Synthesizers, and students in classes or teams participating in the Forecast Challenge. Given this audience, we have identified 3 different dashboard elements that will be important to include:
forecast synthesis overview,
summary metrics about the Forecast challenge, and
self diagnostic platform.
During the June 2023 Unconference in Boulder, our team focused on scoping all three dashboard elements and prototyping the forecast synthesis overview. The objective of the synthesis overview visual platform is to support community learning and emergent theory development. Thus, the synthesis visualizations are aimed at creating a low bar entry for multi-model exploration to understand model performance, identify characteristics that lead to stronger performance than others, the spatial or ecosystems that are more predictable, and temporal forecast validity.
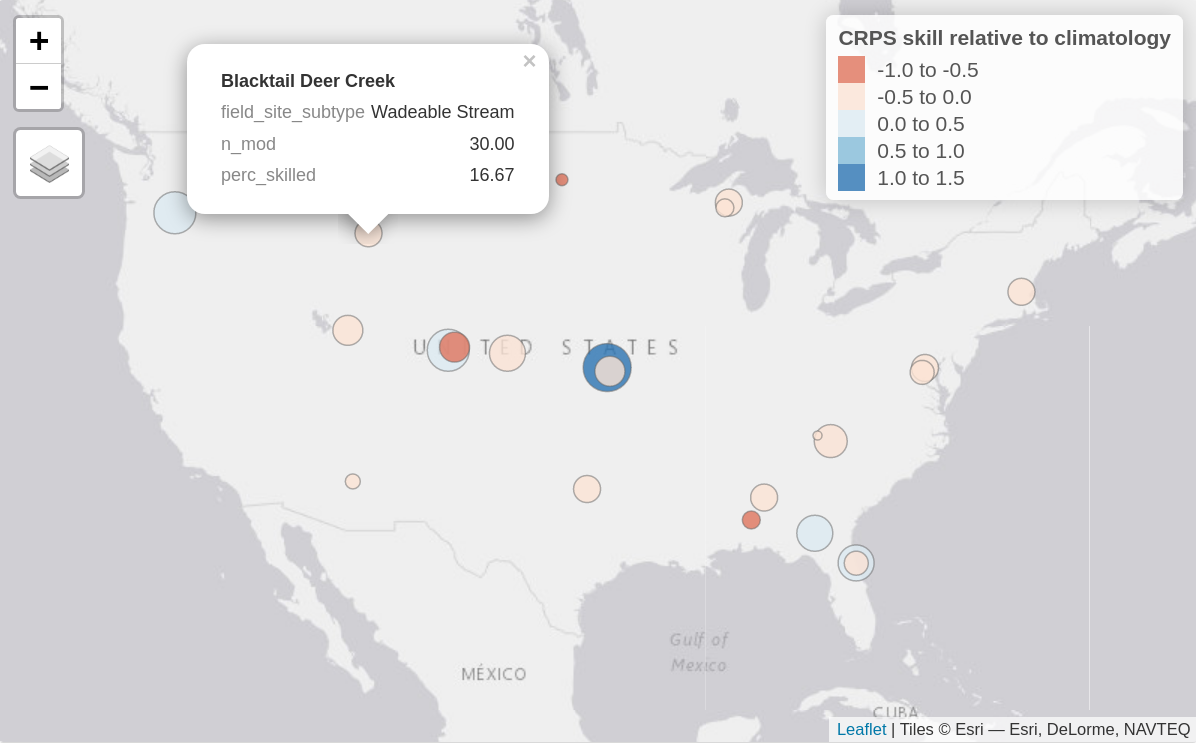
You can view the prototype developed during the meeting HERE and in Figures 1 and 2.
Figure 1. Static image of an interactive map of aggregate forecast skill relative to climatology at each forecasted sites, here showing the water temperature forecasts for the aquatics theme. Bubble colour represents the continuous rank probability score (CRPS) skill relative to climatology with positive values (blues) showing submitted models on average perform better than climatology and negative values showing submitted models perform worse (reds). The size of the bubble represents the percentage of submitted models that outperformed the climatology null (i.e., larger sized bubbles have a higher percentage of skilled models). When hovered over, the bubbles show this percentage (perc_skilled), the site type (field_site_subtype), as well as the total number of models forecasting at that site (n_mod).
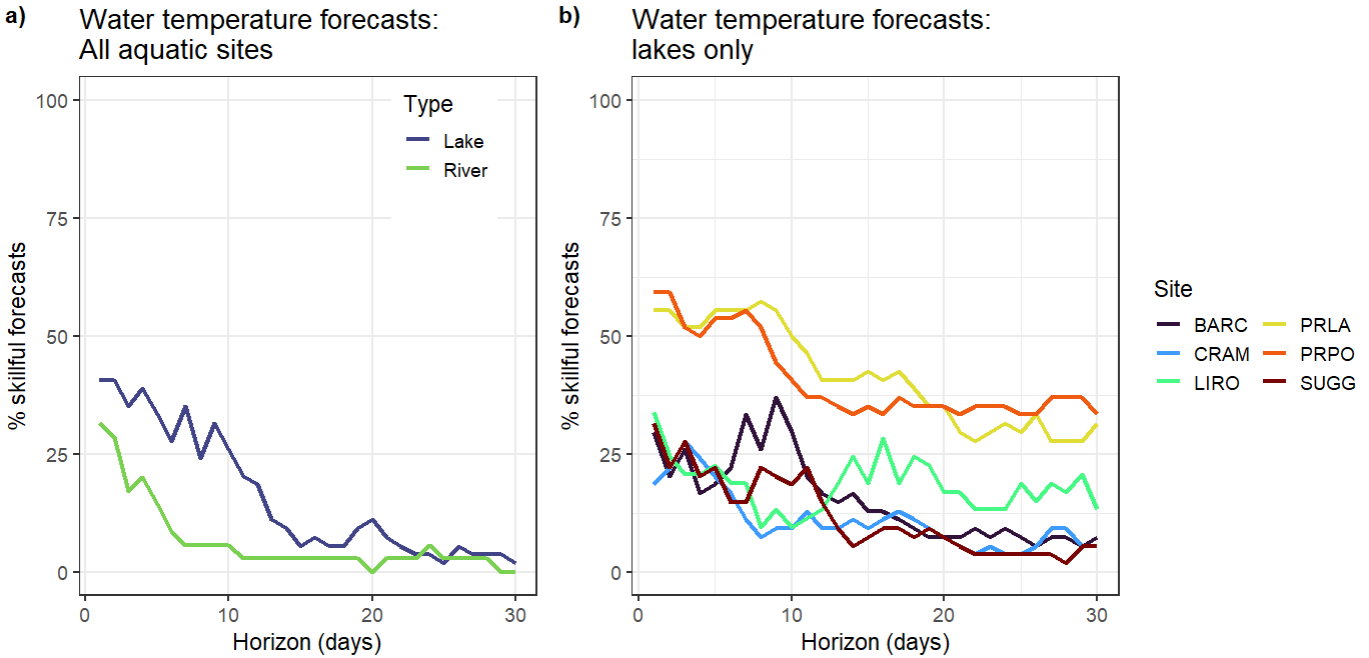
Figure 2. a) Percentage of submitted models that are classed as ‘skillful’ (outperform the null climatology forecast based on the continuous rank probability score metric) at the river (n=27) and lake sites (n=6) for water temperature forecasts at each horizon from 1 to 30 days ahead. b) Percentage of submitted models that are classed as ‘skillful’ for water temperature forecasts at six of the lake sites (https://www.neonscience.org/field-sites/explore-field-sites).
Developing these graphics requires aggregation of skill scores.There are a multitude of metrics that can be used to calculate the skill score, which each have their own benefits and flaws. Thus, there should be multiple skill scores for different metrics with clear presentation of what metric is used at a given visualization. Additionally, in order to isolate what sites are more interesting from a model development perspective, there needs to be a comparison of how many of the models meet a baseline skill score at a given site at a chosen time frame. That allows isolating challenge areas and also easily informs which models really succeed at situations where others struggle. For better future analysis of how models perform at certain sites, we also envisage the visualization to include the skill scores for the relevant drivers (NOAA weather) for comparison. For example, if we see a drop in skill across models in water temperature projections after some time, there should be a direct method to assess if this reflects overall flawed model dynamics or if the weather forecast driving the water temperature loses its reliability. This also allows the user to approximate a maximum length in which the model performance analysis is at all useful.
In addition to the main synthesis overview, the goal of this platform is to support exploration of synthesis data. For all themes, there was general agreement that it would be useful to pull up at a glance, site characteristics, a photo, and basic summary statistics about the number of models and model performance.
During the meeting, we worked with the Aquatics and Beetles Challenge teams to identify some of the key data aggregation groupings that will be important to facilitate exploration. One important distinction arose during the conversations – the baseline model, time scale, and data latency. For Aquatics there is a long time series of data that create a climatology and data are provided relatively quickly via data loggers. For Beetles, there is a different null baseline model given the length of historic data that is different at each site and it takes a year to provide beetle abundance and richness assessment. There was also a desire to have specific types of synthesis visualizations including the species accumulation curve over years, 3-year running average, and indicating the lower and upper bounds of a particular variable (use in scale). Thus, for both Beetles and Aquatics there are similarities and differences in the types of groupings that would be most useful to support synthesis exploration.
Table 1. Different data groupings that would be useful to facilitate easy-to-develop synthesis visualizations of the EFI-NEON Forecast Challenge models to facilitate learning and community theory development.
Groupings
All Themes
Aquatics
Beetles
Team / Challenge
theme, site, model ID, customized classroom or team groupings
particular variables (e.g., DO) within a theme
Spatial / Ecosystems
sites, NEON domains, site type (river, stream, lake…), altitude (high vs lowlands)
sites by distance, dominant NLCD classification
Temporal Scale
average for past year, seasonal groupings,
1 day, 5 days, 7 days, 15 days, 30 days
14 days, growing season, multi-year (up to 5 year) forecasts
Models
best model at each site, model inputs, model structure, functional type, output uncertainty representation
model run time, model computational requirements
Skill Scoring
current skill forecast approaches, better than climatology/null baseline,
comparison of your model to the best forecast
Other Features
environmental variables and weather forecast observations
comparison with weather/climate forecast skill
disturbance events (e.g., widlfire), growing season dates at each sites, site disturbance characteristics (e.g., mowing, fencing)
In addition to the synthesis overview, there were two complementary and linked platforms that will create the dashboard. First, the objective of the forecast challenge overview is to provide a basic summary of metrics related to the overall EFI NEON Ecological Forecasting Challenge. Specifically, the metrics that would be included are: number of forecasts submitted, number of unique teams, percentage (or median of all) of models that are better than climatology or a null model per theme, and total forecast and observation pairs.
Second, the objective of the self-diagnositic platform is to provide an overview for individuals or team forecast contributions and performance. The types of summaries that will be provided for the forecasters are: confirmation of forecast submission, date of the most recent forecast submitted for a model, model performance relative to climatology or null model, model prediction versus observation, model performance vs other selected models, and model skill over a specific time horizon (to assess whether it performs better over time).
Overall, the goal of the re-envisioned visual dashboard is to create platforms that will allow us to track challenge engagement, individually or as a team diagnose any model submission problems and performance improvement opportunities, and support community theory development through a synthesis given the range of models submitted through the EFI NEON Ecological Forecasting Challenge. Long-term, if this platform structure is useful and robust, it could be applied to other systems where there are multi-model predictions and there is a desire to collaboratively learn together to improve our theoretical understanding and forecasts to support decision-making.
We are looking for input from the EFI community on the synthesis dashboard for other themes, to discuss with individuals what synthesis would be most relevant to phenology, terrestrial, and ticks forecasters. Reach out to info@ecoforecast.org to share your thoughts or let us know you would like to join future conversations about updating the dashboard.
The 2023 EFI Unconference, hosted by the Ecological Forecasting Initiative Research Coordination Network (EFI RCN) and supported by the National Science Foundation, brought together 45 passionate individuals at the National Ecological Observatory Network (NEON) headquarters in Boulder, Colorado on June 21-23, 2023 to work on a diverse range of projects that were nominated and selected by the participants. With a focus on collaborative problem-solving, the Unconference fostered a unique environment for participants to exchange knowledge, generate new approaches, and advance the field of ecological forecasting.
In addition to project development, activities included a warm welcome from Kate Thibault, NEON Science Lead, icebreaker activities, expertly facilitated by Cayelan Carey from Virginia Tech that helped participants connect and form meaningful relationships, a tour of NEON facilities, and a poster session and social hour, where participants showcased their research and projects. Through these activities, Unconference participants and NEON staff were able to engage with one another, exchange feedback, and forge new collaborations.
To ensure a productive and focused Unconference, participants engaged in a review of project ideas and subsequent project selection. This process allowed attendees to propose projects aligned with their interests and expertise and fostered a sense of ownership and investment in the outcomes. Ten project groups developed out of the 24 that were initially proposed as part of the pre-meeting preparation.
Summaries provided by each project working group are listed below. Some groups will provide additional details in forthcoming blog posts, so be sure to watch for those future posts.
This was the first in-person EFI event since 2019 and it was absolutely lovely to be in the same room to meet new people and to see in-person people we had only seen on Zoom before. We appreciate the Unconference participants’ willingness to share their time, talents, and perspectives. As you will read below, there were a number of accomplishments over the three days of the meeting and we look forward to seeing future outcomes from what was developed at the Unconference!
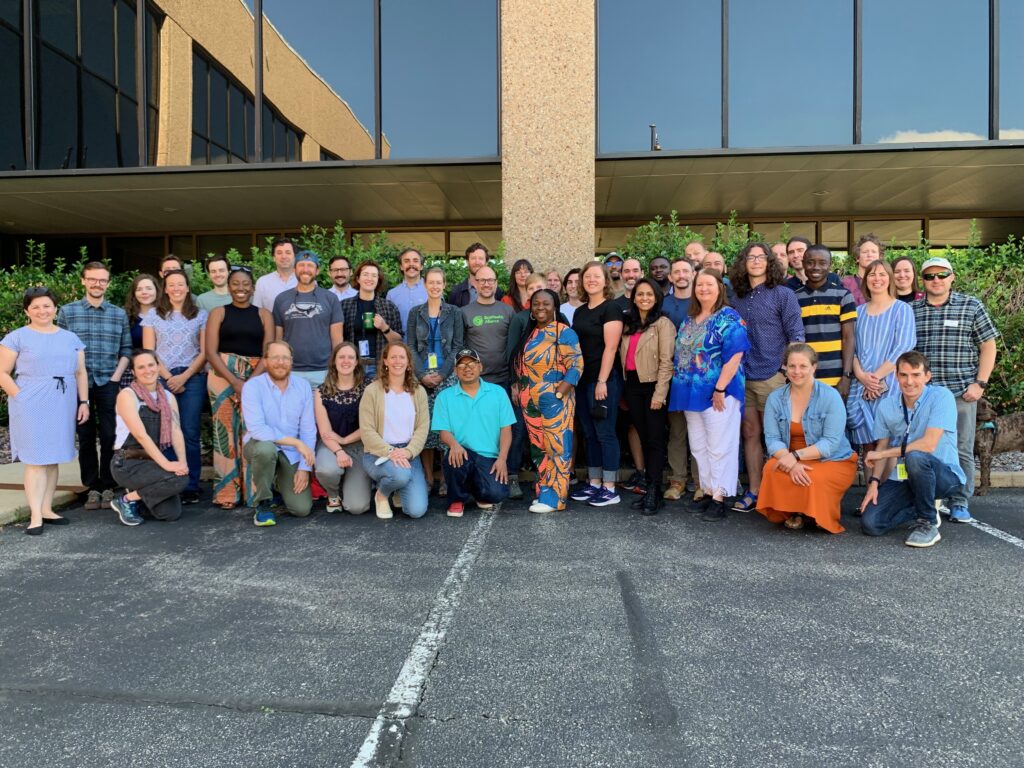
Unconference participants. Photo courtesy Quinn Thomas
Participants: John Smith, David Durden, Emma Mendelsohn, Carl Boettiger
To date, the NEON Ecological Forecasting Challenge has been focused on generating near term forecasts for specific sites. However, many interesting ecological phenomena occur across both time and space. At the EFI 2023 Unconference, our group prototyped a forecasting challenge that is also spatially explicit. For our prototype forecasting challenge, we focused on Leaf Area Index (LAI) recovery in post-burn areas. Our focal sites so far include the California August complex fire and the Colorado East Troublesome fire. Our work at the Unconference focused on building cyber-infrastructure to ingest and aggregate data, build target files, assess models using proper scoring rules, and build baseline climatological forecasts. Current progress, including an example notebook and a detailed workflow diagram, are available on GitHub: https://github.com/eco4cast/modis-lai-forecast/. Current and future work includes building additional baseline models, setting up a submission portal using GitHub actions, and integrating additional sites to include a variety of ecoclimatic domains.
Participants: Noam Ross, Eli Horner, Ashley Bonner, Mike Dietze, Chris Jones
Interest and use of ecological forecasting have increased in recent years due in large part to the efforts of EFI, including the NEON Ecological Forecasting Challenge. However, only a small percentage of ecological forecasts published have fully quantified and partitioned their forecast uncertainties. Quantifying and validating model predictions and uncertainties allows for understanding the degree of uncertainty in forecasts and how much we understand the underlying ecological system (our ability to predict them). Partitioning forecast uncertainties allows for increased focus on data collection efforts that could lead to improved model performance and reduction in uncertainty. Our group worked toward creating a tutorial for how to quantify and partition forecast uncertainties and validate model predictions with uncertainty by using the NEON Phenology Forecasting Challenge. We are using an ARIMA model and a random forest model as examples. During the Unconference we were able to get both models working and partition uncertainties. We are finishing up the code base, tutorial, and discussing challenges with each type of model when it comes to performing uncertainty quantification and partition.
Forecasting Impacts: Measuring the Current and Future Impacts of EFI
Participants: Rebecca Finger-Higgens, Jessica Burnett, Alexis O’Callahan, Ayanna St. Rose
It turns out getting-to-know-you style ice breakers can provide more than just a few new friends, they can also demonstrate group priorities and motivations for coming together in the first place. On a sunny morning at the NEON Headquarters in Boulder, CO, Cayelan Carey (Virginia Tech) asked the group of EFI Unconference participants to organize themselves based on whether they individually felt that the goal of forecasts were for understanding or decision making. As the participants shuffled around and considered the question before them, the final results revealed a pattern among the group that resembled a skewed desire for forecasts to inform decision making versus broadening the understanding of ecological systems. However, the ability of ecological forecasts to effectively inform decision making has not clearly been measured. Besides directly impacting decision making processes, how do we, as a grassroots organization, recognize and measure the other societal impacts that EFI might be, or capable, of creating?
This led our group to think through ways that EFI could measure impacts, to ask: what are the impact goals and achievements of EFI, what does the community want out of EFI, and what is the best way to measure these often hard to measure metrics? Using five categories of societal impacts (instrumental applications, connectivity impacts, conceptual impacts, capacity building, and socio-ecological impacts), we developed a poll for Unconference participants to assess the priorities and current thoughts of this representative group. The poll results suggest that EFI community goals emphasize conceptual impacts (i.e. improve ecological understanding), connectivity impacts (i.e. maintaining and developing community and partnerships) and instrumental applications (i.e., applications for decision making). We also found that EFI has made the greatest advancements in capacity building (i.e., curriculum development, short courses), conceptual impacts (i.e., working groups), and connectivity impacts (i.e., newsletters and conference sessions). These discoveries have allowed us to identify a space for the creation of a concrete link between the connectivity of forecasting and the desired application outcomes of the group. It has allowed us to develop a number of recommendations for the steering committee and the EFI community. Some of these recommendations include focusing on if, how, and why a created forecast product achieves one of the five predefined societal benefits. Together, we hope to continue to build on the vision statement of EFI to build forecasts to understand, manage, and conserve ecosystems in a measurable and remarkable way.
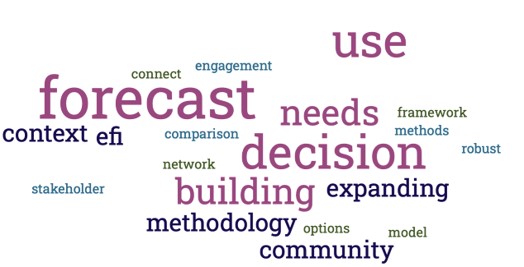
Figure 1: Word cloud generated from Unconference participant responses to the question “describe the potential, importance, or value of the community of EFI”.
Reenvisioning the NEON Ecological Forecasting Challenge Dashboard Visualization
Participants: Melissa Kenney, Michael Gerst, Toni Viskari, Austin Delaney, Freya Olsson, Carl Boettiger, Quinn Thomas
With the growth of the NEON Ecological Forecasting Challenge, we have outgrown the current Challenge Dashboard, which was designed to accommodate a smaller set of forecasts and synthesis questions. Thus, we have reenvisioned the next stage NEON Forecast Challenge Dashboard in order to facilitate the ability to answer a wider range of questions that forecast challenge users would be interested in exploring. The main audience for this dashboard is NEON forecasters, the EFI community, Forecast Synthesizers, and students in classes or teams participating in the NEON Ecological Forecasting Challenge. Given this audience, we have identified 3 different dashboard elements that will be important to include:
forecast synthesis overview,
summary metrics about the Forecast Challenge, and
self diagnostic platform.
To learn more about the dashboard redesign approach, see the prototypes here. Find more details about this project in this blog post.
Transporting Models Between NEON and non-NEON Systems
Participants: Brendan Allison, Olufemi Fatunsin, & Jeff Mintz
A community of practice is increasingly active in developing models and forecasts for NEON sites. We asked: how can we take models trained on NEON data and refine them for use in another context? Similarly, how can we take models trained on non-NEON data and refine them on NEON data? This goal of transplanting models can empower a range of applications, including local field studies, adaptive management, and data fusion from multiple monitoring networks, enabling greater statistical power for big ecological questions. Whether transporting a model to or from NEON, the challenges are effectively the same. These included unbalanced data, different monitoring protocols, different predictors, and different site selection criteria. To focus our efforts, we picked the particular case study of bringing together NEON vegetation survey data with similar datasets generated under the Forest Inventory Analysis (FIA) program. Our first product was the development of a Bayesian multilevel model with the capacity to scale to the integration of multiple sets of continental or global-scale monitoring networks, or shrink to the job of predicting outcomes at a single site, but informed by a shared global layer. With this case study in mind, we have been building a codebase for processing the relevant NEON and FIA forestry data and for joint modeling of residual error across monitoring systems in Stan, a popular probabilistic programming language. Find more details about this project in this blog post.
ML-based Uncertainty in the NEON Ecological Forecasting Challenge
Participants: Marcus Lapeyrolerie, Caleb Robbins
How can machine learning (ML) provide a solution to estimating forecast uncertainty across NEON Ecological Forecasting Challenge? We generated a proof-of-concept workflow combining two machine learning approaches to make probabilistic forecasts. Random forests were used to learn relationships between forecast challenge variables and past NOAA weather data and to make predictions. While these models were able to make forecasts that perform well in approximating the future target time series, they were not implemented to provide estimates of uncertainty. We explored how we could use past data along with these deterministic forecasts to generate probabilistic forecasts. Our approach was to train another machine learning model to make probabilistic forecasts on the residual errors from the previous Random Forest models. We then used these predicted residual error forecasts to modify the Random Forest-based forecasts. This combined approach holds potential as it could be used in a plug-n-play manner, where this method could correct the deterministic (or even probabilistic) forecasts from any model to account for temporal trends in the residual error and provide uncertainty estimates. In our next steps, we will work on creating an automated workflow to generate residual error forecasts for the Eco4Cast challenge.
Ground beetles are a versatile species with which to measure biodiversity, yet they lack behind other EFI NEON Ecological Forecasting Challenge themes in terms of forecasts and models. Our group at the Unconference wanted to figure out why forecasters were not submitting to the NEON Ecological Forecasting Challenge Beetle Communities Theme and how we could remove those barriers to increase forecast submission. We created a tutorial (in progress) that describes general goals for forecasting ecological communities, a how-to on submitting a forecast, some of the challenges in forecasting ecological community data, and examples of forecasts people might submit to begin to address those challenges. We first reviewed the underlying data structure of the pre-made targets file that had been developed for the forecasting challenge. We then combined currently available code for a null model, an ARIMA model, and an available tutorial for working with data from the Aquatics Challenge into a workable tutorial to prepare and submit forecasts to the Beetle Challenge. Our goal is to finalize the tutorial by adding a random walk model and more detail on how to add additional covariates to the model, including climate variables. We are also designing a new targets file that has different variables of interest at finer spatial scales at a given NEON site (e.g. plot or habitat information, survey effort). The beetles community data provides an example of when patterns in non-continuous or seasonal data may be poorly capture by a simple model (e.g., ARIMA). When there is latency or gaps in the data more data processing is often required than when using continuous sensor-captured data. Knowing the experimental design is also critical to be able to design a model to build understanding. We hope that this tutorial increases overall interest in submitting forecasts to the beetle forecasting challenge and removes barriers that may prevent forecasters at all levels from submitting. Further information and development on community ecology and biodiversity data is critical for understanding many different biological systems, can help researchers broaden their understanding of how and why communities change over time, and can better provide decision-making tools for ecosystem monitoring.
Towards Principles for Designing Inclusive Ecological Forecasts
Participants: Anna Sjodin, Mary Lofton, Sean Dorr, Jody Peters, Jason McLachlan, Cazimir Kowalski, Melissa Kenney, Katie Jones
Our group is interested in exploring opportunities for improving inclusivity in ecological forecasting. Through discussion, we identified the ten principles of Design Justice (Box. 1) as a potential mechanism for evaluating the inclusivity of forecast products, services, and systems.
We use design to sustain, heal, and empower our communities, as well as to seek liberation from exploitative and oppressive systems.
2
We center the voices of those who are directly impacted by the outcomes of the design process.
3
We prioritize design’s impact on the community over the intentions of the designer.
4
We view change as emergent from an accountable, accessible, and collaborative process, rather than as a point at the end of a process.
5
We see the role of the designer as a facilitator rather than an expert.
6
We believe that everyone is an expert based on their own lived experience, and that we all have unique and brilliant contributions to bring to a design process.
7
We share design knowledge and tools with our communities.
8
We work towards sustainable, community-led and -controlled outcomes.
9
We work towards non-exploitative solutions that reconnect us to the earth and to each other.
10
Before seeking new design solutions, we look for what is already working at the community level. We honor and uplift traditional, indigenous, and local knowledge and practices.
As a first step towards applying the Design Justice principles to EFI-created products, services, and systems, our team evaluated to what degree the ten principles were evident in the design of the NEON Ecological Forecasting Challenge. We identified several ways in which the design of the Challenge was well-aligned with Design Justice Principles (e.g., Principle 4: We view change as emergent from an accountable, accessible, and collaborative process, rather than as a point at the end of a process.), as well as areas in which we thought we could improve (e.g., Principle 3: We prioritize design’s impact on the community over the intentions of the designer).
Moving forward, we are soliciting broader participation from all EFI community members in small focus groups to continue our internal evaluation of the inclusivity of current EFI products, with the ultimate goal of furthering the inclusivity of ecological forecasting by developing recommendations towards a more complete alignment of EFI-designed products with design justice principles. If you are interested in participating in such a focus group, please provide your contact information in the Google Form linked here.
A proactive step toward decision-ready forecasts: Fusing iterative, near-term ecological forecasting and adaptive management
Participants: Jaime Ashander, LM Bradley, Mark Buckner, Nathan Byer, Cayelan Carey, Michael Gerst
This group aimed to improve the conceptual tools for co-production of ecological forecasts that aid in decision making. We identified that there is a need for tighter conceptual integration of the iterative, near-term ecological forecasting cycle (as practiced by the EFI community) with the adaptive management cycle (as practiced by communities of natural resource managers) and the broader context for management decisions. While prior frameworks have treated the iterative, near-term forecasting and adaptive management cycles as independent, with limited points of contact, a careful fusion of these processes may increase conceptual utility for co-production. As a first step towards a more useful framework, we then located iterative, near-term forecasting activities within the management decision making process, using the PrOACT (Problem, Objectives, Alternative Actions, Consequences, and Tradeoffs) tool from structured decision making. After creating this draft version of a framework, we explored several targeted case studies in ecological forecasting and adaptive management to evaluate its efficacy as a tool for fusing forecasting and adaptive management efforts. We will continue meeting to develop these ideas and work towards a manuscript.
Developing models to understand the transmission of pathogens in disease ecology is critical to understanding the spread of diseases and how to prevent them. A model study is relied on to simulate the spread of disease and predict the effectiveness of different control strategies. Model forecasting is also critical, both for planning and enacting public health interventions but also for building our understanding of the sometimes complex drivers of disease dynamics across space and time. Vector-transmitted diseases (e.g.,mosquito- or tick-borne) represent an exceptionally difficult case since key processes affecting spread and transmission are not directly reflected in typical public health monitoring. For example, the presence and behavior of the vector species themselves, but often there are infection reservoirs in wildlife populations as well. In this way, connecting ecological forecasts to human epidemiological forecasts is an important challenge to tackle.
The NEON Ecological Forecasting Challenge has already included a tick forecast challenge, although it has not yet been tied directly to tick pathogen status monitoring or human health. In this project, we worked on the West Nile Virus (WNV), which is a mosquito-borne disease in the family of flaviviruses. The primary host is birds (across a wide range of species), while humans are the dead-end host. WNV occurs and is commonly spread, especially in the summer, through mosquito bites. Our goal at the EFI Unconference was to examine the opportunities that NEON data could provide to create impactful forecasts for the public’s health from vector-borne diseases, focusing on WNV. Especially since humans are a dead-end host, understanding and forecasting the disease dynamics demands ecological, human, and human data. We intend to forecast the mosquito abundance as well as the infection rate in humans over time, incorporating the mosquito abundance, seasonality, drivers, and co-occurring bird abundances.
We built a preliminary bridge that connects National Ecological Observatory Network (NEON) and Center for Disease Control (CDC) data and, through preliminary visualization, demonstrated the potential to match between the NEON mosquito data (abundance and pathogen status) and CDC-reported human cases on a year-by-year and county-by-county level for 14 NEON sites located in counties with reported cases of WNV. A first look at the collected data set showed a relationship between the NEON bird and mosquito abundance that suggests large bird presence is one driving condition of large mosquito abundance in a summer sampling season. Given the relative rarity of WNV compared to some other vector-borne illnesses like Lyme disease, there are definitely some challenges to setting up a forecasting challenge for the full disease dynamics, although we may be able to cast a wider net for human cases in counties adjacent to NEON site counties. We’re excited to build this preliminary effort into a new neon4cast theme, and we’re also eager to dive into the lessons learned from one of the other Unconference projects that examined pitfalls in recruiting broad engagement in the beetle forecasting challenge.
May 17, 2023; updated June 9, 2023 with the Spanish Translation
Antoinette Abeyta1, Jason McLachlan2, Jody Peters2, Nicholas R. Record3, Anna R. Sjodin4§, Olivia Tabares5, Alyssa M. Willson2 Co-authors are listed alphabetically since all contributed substantially to this project.
1University of New Mexico, Gallup, 2University of Notre Dame, 3Tandy Center for Ocean Forecasting, Bigelow Laboratory for Ocean Sciences, 4Environmental Protection Agency (EPA), 5Universidad Nacional Autónoma de México §These views are my own and do not reflect the opinions or beliefs of the EPA.
Spanish Translation/Traducción al Español Following our own recommendations in the Language section, we have provided a Spanish translation for the entire post.Translation by Yerania Serrato-Bucio, University of Notre Dame. Click here to access the Spanish Translation. Siguiendo nuestras propias recomendaciones en la sección Idioma, hemos proporcionado una traducción al español para la publicación completa.Traducción por Yerania Serrato-Bucio, University of Notre Dame. Haga clic aquí para acceder a la traducción al español.
SUMMARY
Here, we introduce a way to evaluate barriers to inclusion in ecological forecasting and environmental sciences using the iterative forecasting and adaptive management cycle, and suggest ways to extend our understanding of ecological forecasting beyond this cycle. We begin by highlighting three examples of barriers to inclusivity (i.e., hypotheses, models, and language). Next, in an attempt to make ecological forecasting a more inclusive discipline through the very ways we conceptualize its component steps, we reimagine the iterative forecasting cycle to emphasize and center marginalized groups. Finally, we provide suggestions for next steps that focus on working with students and reversing marginalization of historically excluded individuals.
We invite anyone with an interest in participating to join these efforts. If you have comments or suggestions or would like to participate as a co-author in a manuscript that builds from these ideas, reach out to us in the comments below, at info@ecoforecast.org, on the #inclusion channel on the EFI Slack group, through Twitter (@eco4cast) or directly contact any of the authors of the blog post.
INTRODUCTION
Ecology, one of the pillars of ecological forecasting, is fraught with experiences of racism and sexism, despite concerted efforts to improve inclusion and reduce barriers to entry (Martínez-Blancas et al., 2023). One of the tasks from the DEI Strategic Plan (developed by the Ecological Forecasting Initiative’s (EFI’s) Diversity, Equity, and Inclusion (DEI) Working Group) is to identify barriers hindering historically excluded individuals’ participation in ecological forecasting and other quantitative environmental sciences. The EFI DEI working group has been discussing this in monthly meetings, at the EFI annual meetings in 2021 and 2022, and at national meetings (e.g., Geoscience Alliance and the Ecological Society of America meetings in 2022). Our goal in this blog post is to spark perhaps new considerations for the EFI community about what the barriers to ecological forecasting are and ways to begin addressing those barriers. We want to open up a discussion with the broader EFI community, and those interested in ecological forecasting, and ask for input on the barriers and the next steps identified, and ask for input about barriers and solutions beyond those that we have already considered.
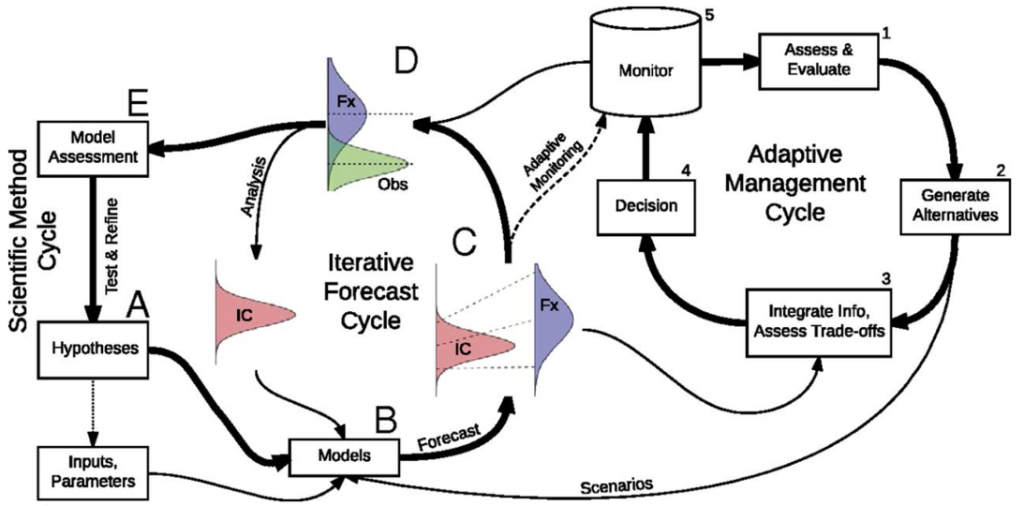
Iterative ecological forecasting in the tradition promoted by EFI is often conceptualized as a cycle that has focused on the technical requirements or research outcomes of forecasting (e.g., Dietze et al., 2018) (shared here in Figure 1). We used this conceptual diagram of the iterative forecasting and adaptive management cycle as a starting point for thinking about the human components required for forecasting and to identify where the cycle presented barriers to entry and persistence in ecological forecasting and in what ways. Often existing forecasting cycles center research outcomes, leaving community as an afterthought. To make ecological forecasting more reflective of the communities we work with, we have to structure our forecasting cycles to center values that are important to the communities we serve.
For example, at the Geoscience Alliance meeting in 2022, we spent considerable time discussing how marginalized communities often do not have access to the internet, computer hardware, and cyberinfrastructure tools that are often taken for granted in the ecological forecasting community (Federal Communications Commission, 2012), which corresponds to part B of the iterative forecasting and adaptive management cycle. The list of barriers to persistence in ecological forecasting quickly became too long for a blog post, as we realized that the forecasting cycle reflects the systemic barriers to inclusivity that persist in ecological forecasting and quantitative environmental sciences more generally. This led to the question: Can we re-envision a forecasting cycle that incorporates inclusion throughout the forecasting enterprise?
Figure 1. Iterative ecological forecasting and adaptive management cycle figure from Dietze et al. 2018.
THE BARRIERS
Hypotheses – Who gets to decide what gets forecasted, and how?
Hypotheses, as they are imagined in the Western scientific process, originate within a specific epistemology, or way of knowing and understanding. However, there are many epistemologies, and without engagement with communities, forecasts developed from and motivated by historical ecological literature will be biased towards what has historically been studied and the tried and true approaches to scientific inquiry. In ecology as in many scientific disciplines, the historical literature is dominated by White men. Additionally, the topics and studies that have produced the most amount of data and positive results (Nakagawa et al. 2022), or the data streams that provide consistently collected, archived, and available data, will be the most represented and continually reinforced. An alternative is co-produced forecasts, which center the assumptions, knowledge, and ideas most valuable to a community’s needs (Nyadzi et al., 2022; Record et al., 2022).
Funding similarly reinforces perpetual barriers to entry for historically marginalized communities. Research funds that continually reward novelty and the bleeding edge of science often don’t align with local or community needs (Flagg, 2022; Van Horne et al., 2023), and there is often no incentive to continue to work with local communities on persistent problems after the grant cycle ends. Moreover, researchers from historically excluded groups, often more in touch with local or community needs or working in the Global South, get their work published and showcased less than scientists in Global North institutions (Smith et al., 2023), thus perpetuating barriers to publishing and funding research related to community problems.
Models – Who generates the model, and who has access to the models and data?
Models are, by definition, simplifications of the truth. The aspects of truth that are simplified are inherently biased by those generating the models, and models are often developed to reflect a researcher’s hypothesis about how a system works. The more aspects that must be omitted to create a working model, the more opportunities exist for removing perspectives and truths understood by marginalized people. Generation of models is subject to the same epistemological weaknesses as hypotheses because models in many ways are our hypotheses. For ecological systems, specifically, mechanisms are complex, and inclusion of epistemological diversity becomes increasingly important for contextual understanding in such complex systems (Page, 2014). Importantly, mechanistic understanding and decisions based on information produced in partnership among epistemologies are more robust (Berkes, 2009; Schuttenberg and Guth, 2015; Wheeler and Root-Bernstein, 2020). So, in addition to the inherent value of a more inclusive process (Morrison and Steltzer, 2021; NASEM, 2022), incorporating different perspectives can provide a more holistic, and arguably stronger, understanding of natural systems.
Additionally, creation of the models that produce forecasts is influenced by who has access to use or run the models. Not all models are open source and many have a historical legacy of ownership which can make it more difficult for individuals new to the field to learn how to run a certain model. Even models that can be built from scratch (e.g., linear regression models) require statistical knowledge that is often inaccessible to scholars outside of research intensive academic settings.
Data ownership can also be a barrier to creating forecasting models. On one hand, there are many open source data sets (e.g., NEON). However, these data may be too big to access on personal laptops, the data are often not collected equally across locations (e.g., NEON), and the data that have been collected will be biased towards the interests of those who have set up the collection processes. There are also cases where data sovereignty needs to be considered (Vera et al., 2019) and where data should be kept proprietary (e.g., working with culturally relevant data or human subjects). Similarly, running models and making probabilistic forecasts requires access to computational resources and expertise. Basic quantitative training is not universal nor created equal (Willson et al., 2023).
Language
El uso del inglés como lingua franca en el contexto científico, impone barreras a quienes no son hablantes nativos del idioma en diferentes aspectos. Desde la dificultad para adquirir nuevos conocimientos en una lengua diferente a la materna, pasando por limitación de oportunidades de estudio y laborales, hasta sesgos de publicación y experiencias de discriminación en instituciones académicas (Woolston & Osorio 2019).
A lo largo del siglo XX se ha observado que el inglés pasó de ser parte de un modelo plurilingüe de comunicación científica internacional, en el que otros idiomas, como el francés y alemán tambien eran comúnmente utilizados, a tener un dominio casi absoluto en la comunicación de las ciencias naturales y sociales, lo que limita cómo y quienes pueden comunicar ciencia e incluso aprenderla (Hamer, 2013; Amano et al 2021).
En el caso particular del Ecological Forecasting, al aprendizaje de tópicos complejos como la estadística, modelación matemática y programación, se añade la dificultad de hacerlo en inglés para hablantes ESL (English as a Second Language), ya que la mayoría de los textos, artículos y recursos de apoyo (e.g. foros, videos, tutoriales) están en este idioma (Amano et al. 2021). Prueba de ello es el repositorio que como Education Section de EFI hemos colectado, con materiales exclusivamente en inglés. Si bien esto está sesgado por la composición lingüistica de nuestro grupo, es un reflejo de muchos tópicos en ciencias.
Si bien la enseñanza del idioma inglés suele estar en la curricula de la gran mayoría de países no angloparlantes desde la educación básica, y un 20% de la población global se encuentra estudiando inglés como segunda lengua (TEFL Academy 2020), la comprensión necesaria del idioma para poder aprender y producir predicciones ecologicas dificilmente puede ser garantizada para personas que no hayan recibido instrucción privada y vengan de contextos socioeconómicos provilegiados. Esto impone dificultades a las personas interesadas en investigación que no hablen inglés tanto para adquirir nuevos conocimientos como para hacer posgrados, colaboraciones de investigación y publicar en revistas internacionales (Woolston & Osorio 2019; Amano et al 2021).
MAKING INCLUSION EXPLICIT IN FORECASTING CYCLES
The forecasting cycle shown in Figure 1 has appeared in different iterations in subsequent studies (e.g. Moore et al. 2022). We’ve added two alternative forecasting “cycles”, described below, to this list, with a goal of reducing barriers to inclusivity. As we considered alternative figures we asked, “What should it look like? Should it be a cycle at all, or some other conceptual model?” The two figures presented here should be considered as first drafts and provide some food for thought on barriers to inclusivity in the forecasting process and how to address them. Moving forward, we hope that the redrawing of the ecological forecasting framework could, itself, be an inclusive process. We present figures depicting forecasting cycles in this slide deck, where we welcome additional contributions from readers and invite anyone interested to join our efforts to write a manuscript associated with this project.
Community-Centered Forecasting Cycle – Example 1
Science is often lauded for its objectivity, but each hypothesis or question carries with it inherent biases that reflect the values, thought processes, and experiences of the researcher(s), as discussed above in The Barriers section. These values show when scientific findings are applied, as in forecast-based decision-making, and the end user is often different from the researcher, with different values, thought processes, and experiences. In the DEI working group at EFI, we think a lot about these differences and how to unite them for the common goals of improving the field of ecological forecasting and promoting informed ecological decision-making. We recognize not only the inherent value of inclusivity (Morrison and Steltzer, 2021), but also the benefit that different experiences and expertise can have on an emerging field like ours (Woelmer et al. 2021, Willson et al., 2023).1
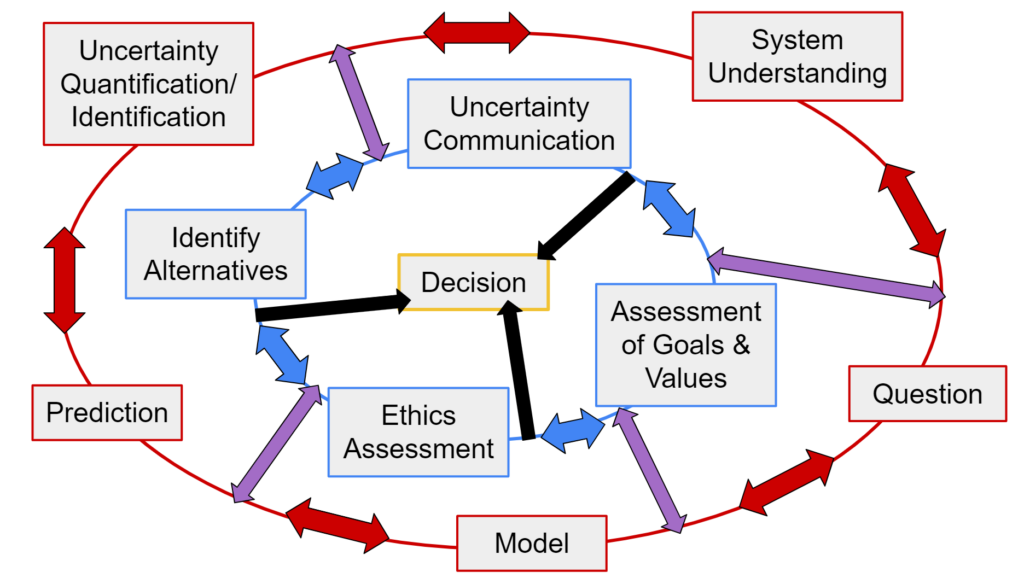
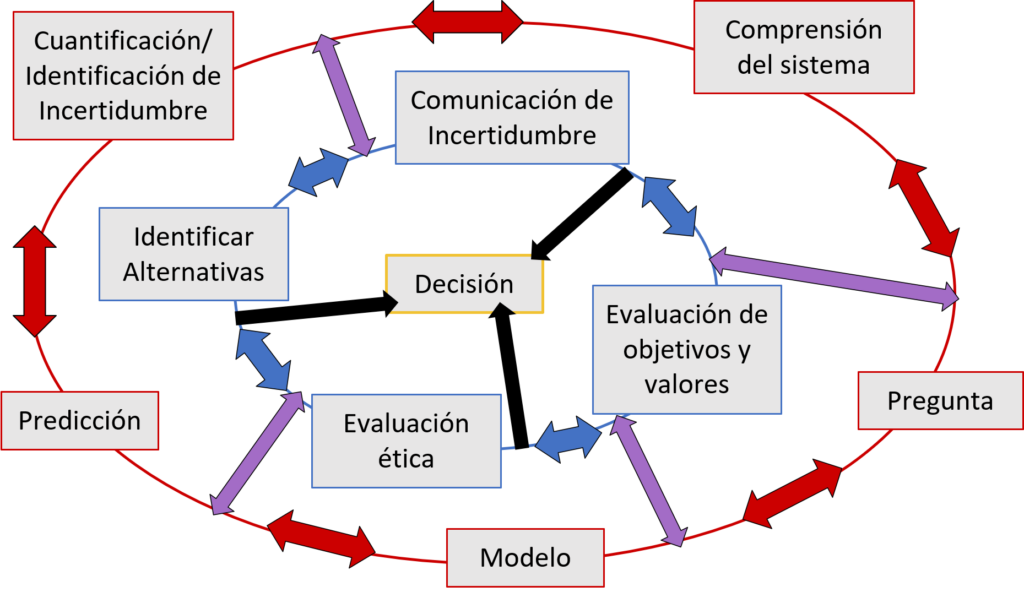
Figure 2. One imperfect attempt at visualizing a diversity-focused forecasting cycle. In this cycle, whether the end goal is systemic understanding or decision-making, forecaster biases and goals are explicitly considered.
With inclusion front of mind, we created figures such as Figure 2 to focus the forecasting cycle within a diverse community of practice. Figure 2 stresses centering project goals within the values of the researchers and end users (blue circle). Ethics, therefore, cannot be an afterthought: the continuous evaluation and re-evaluation of goals, values, and ethics should be a discrete action item. These biases are then explicitly acknowledged as informing the scientific process (the outer red circle), and vice-versa (purple arrows). Importantly, those involved in the forecasting research effort can join the process from either the blue or ourter red circle, demonstrating the interdisciplinary qualities of forecasting. And finally, decisions can be made without science, but they cannot be made independently of personal values and biases (black internal arrows).
1 The value of diversity and inclusivity goes far beyond just ecological forecasting. Also, see the DEI statement on the EFI DEI Working Group webpage.
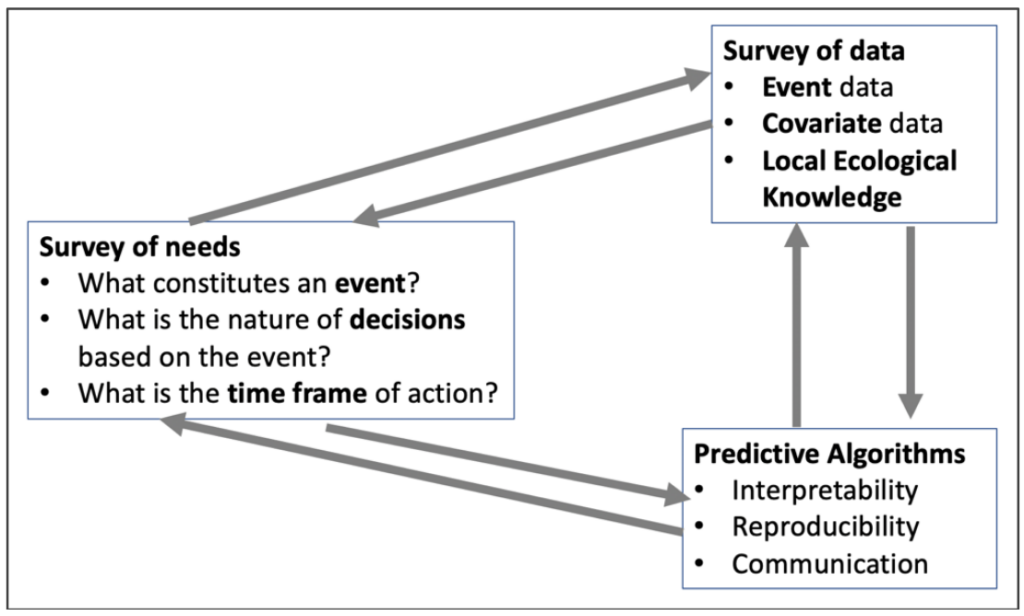
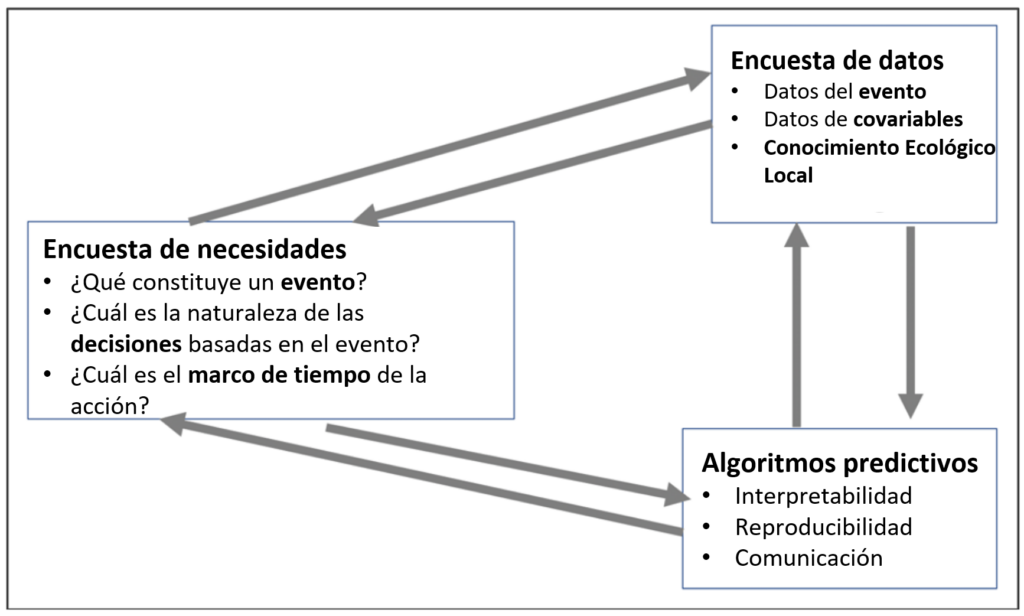
The Tandy Center for Ocean Forecasting works on developing forecasts for communities, industries, and other users. In thinking about inclusivity, individuals at the Tandy Center are thinking about those communities that are affected by the forecasts they create and the decisions based on them. In the conventional forecasting cycle (Figure 1), scientists are centered. However, some of the lessons that ocean ecosystem forecasters have learned and have been generous to share over the years have had to do with unintended consequences and accidental harms caused by well-intentioned forecasting programs (Hobday et al., 2019). Being a forecaster can be precarious, and it’s probably impossible to avoid every pitfall, but hopefully, we can learn from some of these lessons. The Center works under the belief that being more inclusive can help align the needs of communities using, or affected by, the forecast with the design of the forecasting program. The schematic included below (Figure 3) comes from the Tandy Center’s guidance documentation (Record, 2022). It’s not exactly a cycle, but more like a map to guide dialogues with different community groups so that they can collaborate at each step. There’s also a video that walks through the figure. In short, communities should be partners throughout the process, contributing to the design of the system. By centering forecast users rather than forecasters, we hope to help forecast development be more accessible and reach new people and places that might be under-resourced or otherwise excluded from the mainstream of forecasting applications.
Figure 3. Schematic diagram of the stakeholder-based framework for building forecasting systems (Record 2022). Arrows indicate two-way movement between any of the components of the framework, potentially multiple times.
Notable weaknesses that still remain
Of course, including everything in a single figure is challenging (hence this blog post). Continued discourse about how to address ongoing weaknesses is shared in Next Steps. Additionally, salient ideas have been left out of or de-emphasized in the above figures but have been discussed throughout the EFI DEI working group meetings. For example, diversity, equity, inclusion, and justice (DEIJ) efforts are often listed in grant applications as Broader Impacts but are not considered to contribute to intellectual merit. A more thorough list, including some more inclusive alternatives, can be found in Table 1.
NEXT STEPS
Thinking about students
The legacy of barriers to inclusivity has been carried on through science education, and breaking this legacy needs to include thinking about education. Today’s students are highly motivated, eager, and ready to tackle broadly defined diversity, equity, inclusion and justice issues. This passion is shaped from a range of experiences and identities. Good education and pedagogical approaches are attentive to the diversity of learners (Harris et al., 2020; Miriti, 2019; Rawlings-Goss et al., 2018). Teaching takes many forms, but can consist of (1) active and collaborative learning activities (Corwin et al., 2018; Graham et al., 2013), (2) providing student agency and voice (they are co-creators in results), (3) honoring existing knowledge, (4) avoiding deficit language when teaching. Additional resources for inclusive teaching can be found in the Inclusive Pedagogy Resources compiled by EFI as well as this extensive list of inclusive teaching resources and strategies from the University of Michigan’s Center for Research on Learning and Teaching. There are also efforts within the EFI community and the EFI Education Working Group to compile open educational resources (Willson and Peters, 2021; Willson et al., 2023, Table 1), as well as to develop educational modules in collaboration with faculty at Minority Serving Institutions to teach data science tools that incorporate Traditional Ecological Knowledge and cultural values.
Reversing marginalization
Data science continues to have tremendously low rates of representation from historically excluded and marginalized groups. Consequently, data and computational tools are often created from a narrow world view of priorities, values, and practices (see The Barriers section for more details). When these tools are used on marginalized communities, they are often limited to the interpretations, biases, and preconceived notions of the creators of these tools (David-Chavez and Gavin, 2018). Without centering the knowledge, experience, and perspectives of marginalized groups in the creation of these tools, they become tools of oppression, promoting erasure, perpetuating stereotypes, and continuing violence and harm to communities. If we want ecological forecasting to become a tool to enact meaningful and just change, we have to structurally alter our research methods and practices through a lens of intersectionality to center the voices of marginalized communities, make them leaders in the creation of tools, and coproduce models and tools with communities (Crenshaw, 2014). In Table 1, we demonstrate how structural modifications to research practices can improve engagement with marginalized groups, showing the shift of power towards community benefit. By encouraging the forecasting community to thoughtfully consider how to develop collaborations, we hope future research will center and bring in the perspectives of historically excluded individuals.
Connect with us!
Developing this post has been a learning process for the entire EFI DEI Working Group and we acknowledge that this is an ongoing and iterative process where it is important to hear from additional voices and to continue to learn. We hope that this post can help the scientific and EFI community continue to think about barriers to participating in forecasting and environmental sciences and solutions for overcoming those barriers. We welcome comments, suggestions, and feedback on these ideas presented. Our goal is to turn this post into a manuscript that builds from these ideas and we invite anyone that would like to share comments or participate as a co-author in the manuscript effort to reach out to us in the comments below, at info@ecoforecast.org, on the #inclusion channel on the EFI Slack group, or through Twitter (@eco4cast).
Table 1. We provide a list of different topics related to forecasting (and data science and science in general) that demonstrate how structural modifications to research practices can improve the inclusion of historically marginalized groups. The three columns represent situations where there is the most room for improvement in connecting to and centering marginalized groups, where there is room for improvement, and a column with situations that are most beneficial to the most people. It is important to note that this table is written as a generalization, and all research practices in a project should be decided collaboratively with the community and be aligned with their values. This table was inspired by The Wheel of Power and Privilege and other related work (Hierarchy of Indigenous Data, the Global Indigenous Data Alliance, and models for decolonizing science research, e.g., David-Chavez 2019, David-Chavez et al. 2020). You can also view a PDF of the Table HERE.
Topic
Situations with the Most Room for Improvement
Situations with Room for Improvement
Situations that are the Most Beneficial and Works to Center and Bring People in
Community Involvement
– Research is done on communities without input or with limited input from the community – Research dollars are not directed to the community – Researchers are outsiders to the community
– Coproduction of knowledge between researchers and the community – Research dollars are distributed to work with the community – Researchers include community members – Addresses generational and long-scale impacts
– Marginalized communities are leading research initiatives – Research dollars go directly toward marginalized groups – Community members are PIs on research projects – Research involves children and younger generations in the development and execution of projects
Education
– Eurocentric education practices – Value is placed on credentialed programming only – Programs limited to R1 institutions and primarily white institutions – High cost of tuition is inaccessible – Materials are often presented in English only
– Education emphasizes different cultures and values – Improved access to higher education – Programs available to public, community, and tribal institutions. – Inclusion of bilingual materials
– Curriculum material is culturally informed and relevant – Recognition of the impact of non-credentialed programs – Improving access to credentialed/advanced degree programs – Education programs span the spectrum of education (K-12 through post-graduate programs) to promote generational learning – Provides education outside of academic institutions – Traditional ecological knowledge incorporated into education – Materials are created and translated into multiple languages used by the community
Benefits & Harms
– Using tools or data that misrepresent a community – Science is done on others without consent – Perpetuating violence, harm, and erasure of marginalized groups – Communities and people are an afterthought in projects – Values are centered on Western ideals – Does not acknowledge the communities where research comes from
– Science is done with the consent of the community but without input in the design – Research provides knowledge for the community – Prioritizes and centers most privileged communities or most represented communities – Land acknowledgments recognize the legacy of colonization
– Working on science in tandem with communities to benefit communities – Giving agency to marginalized communities to define and access research – Centers people and communities in projects – Values are centered on communities ideals – Land back, or land acknowledgments address the continued harm and benefit to the institution
Computation & Technology
– Requiring subscriptions for software – Limited training options – Limited computational and internet access
– Using low-cost and accessible tools – Providing access to computers or mobile devices – Use of universal design in materials
– Resources developed for individuals without internet access in mind – Open-source materials are used or generated – Computational resources are readily accessible
Data Availability (including journals & tools)
– Data is only available through private access or behind a paywall – Communities and individuals are unable to control data or access to data – Requires specialized software, tools, knowledge of where to access data – Data collected without consent of community or individuals
– Data available via request rather than open online access – Data and tools are published for sharing for further research and collaborations – Data is collected with community knowledge and consent
– Promotes ethical use of data – Acknowledges and supports data sovereignty – Broad education on how to access tools, resources, and data – Data collected with respect to cultural values and practices – Improves the ease of accessing public data – Data is made open upon the wishes and needs of the community
Diversity & Justice
– Homogenous racial or cultural research teams – Research perpetuates harm to marginalized groups or maintains the status quo – Funding is focused on short-term impacts – Projects ends when funding ends
– Researchers work with students from diverse backgrounds – Improved representation of marginalized groups in research spaces
– Diverse teams with agency – Research enacts meaningful social change – Funding and research acknowledge the importance of long-term impacts – Project implementation continues after funding ends
Barreras a la inclusión en la predicción ecológica
Antoinette Abeyta1, Jason McLachlan2, Jody Peters2, Nicholas R. Record3, Anna R. Sjodin4§, Olivia Tabares5, Alyssa M. Willson2 Los coautores se enumeran alfabéticamente ya que todos contribuyeron sustancialmente a este proyecto.
1University of New Mexico, Gallup, 2University of Notre Dame, 3Tandy Center for Ocean Forecasting, Bigelow Laboratory for Ocean Sciences, 4Environmental Protection Agency, 5Universidad Nacional Autónoma de México §Estas opiniones son mías y no reflejan las opiniones o creencias de la EPA. Traducción por Yerania Serrato-Bucio, University of Notre Dame
RESUMEN
Aquí, presentamos una forma de evaluar las barreras para la inclusión en el pronóstico ecológico (Ecological Forecasting) y las ciencias ambientales, utilizando el ciclo de pronóstico iterativo y gestión adaptativa, también sugerimos formas de ampliar nuestra comprensión del pronóstico ecológico más allá de este ciclo. Comenzamos acentuando tres ejemplos de barreras a la inclusión: hipótesis, modelos y lenguaje. A continuacion, reimaginamos el ciclo de pronónstico iterativo enfatizando y centrando a los grupos marginados, en un intento por hacer a la predicción ecológica una disciplina más inclusiva desde su conceptualización. Finalmente, proporcionamos sugerencias para los próximos pasos que se enfocan en trabajar con estudiantes y revertir la marginación de personas históricamente excluidas.
Invitamos a cualquier persona interesada en participar a unirse a estos esfuerzos. Si tiene comentarios o sugerencias o le gustaría participar como coautor en un manuscrito que se basa en estas ideas, comuníquese con nosotros en los comentarios a continuación, en info@ecoforecast.org, en el canal #inclusion en EFI Slack grupo, a través de Twitter (@eco4cast) o contactar directamente cualquiera de los autores de la publicación del blog.
INTRODUCCIÓN
La ecología, uno de los pilares del pronóstico ecológico, está plagada de experiencias de racismo y sexismo, a pesar de los esfuerzos concertados para mejorar la inclusión y reducir las barreras de entrada (Martínez-Blancas et al., 2023). Una de las tareas del Plan Estratégico DEI (desarrollado por el Grupo de Trabajo de Diversidad, Equidad e Inclusión (DEI) de la Iniciativa de Pronóstico Ecológico (EFI)) es identificar las barreras que obstaculizan la participación de las personas históricamente excluidas en el pronóstico ecológico y otras ciencias ambientales cuantitativas. El grupo de trabajo de EFI DEI ha estado discutiendo esto en reuniones mensuales, asi como en las reuniones anuales de EFI en 2021 y 2022; y en reuniones nacionales (por ejemplo, reuniones de Geoscience Alliance y la Ecological Society of America en 2022). Nuestro objetivo en esta publicación de blog es incitar a la reflexión y al diálogo dentro de la comunidad EFI sobre cuáles son las barreras para el pronóstico ecológico y las formas de comenzar a enfrentarlas . Queremos comenzar una discusión con la comunidad EFI más amplia y todos aquellos interesados en el pronóstico ecológico para obtener información sobre las barreras al construir un pronóstico ecológico y los próximos pasos a seguir para enfrentarlas ,así como soluciones más allá de las que ya hemos considerado.
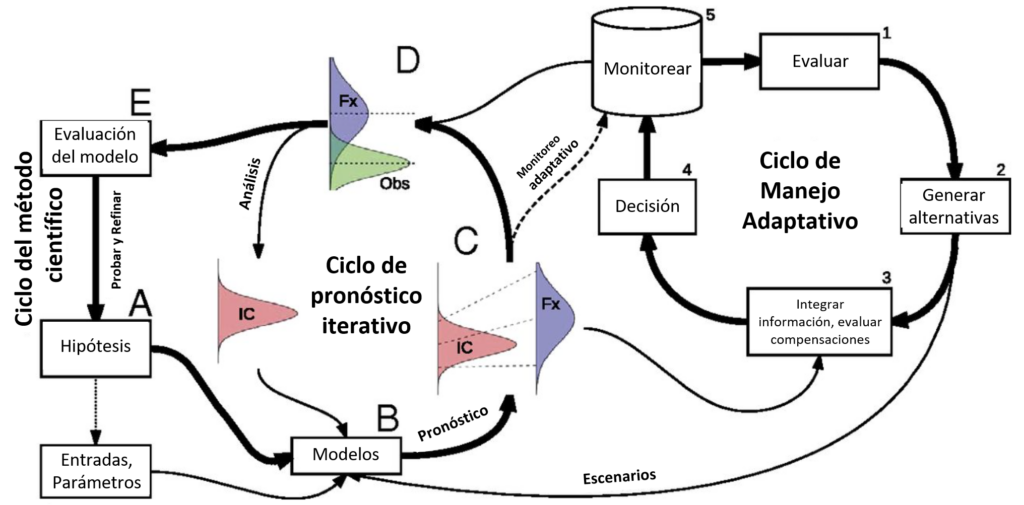
El pronóstico ecológico iterativo en la tradición promovida por EFI, muchas veces se conceptualiza como un ciclo que se ha centrado en los requisitos técnicos o los resultados de investigación del pronóstico (p. ej., Dietze et al., 2018) (compartido aquí en la Figura 1). Usamos este diagrama conceptual del ciclo de pronóstico iterativo y manejo adaptativo como punto de partida para pensar en los componentes humanos requeridos para el pronóstico, e identificar dónde el ciclo presenta barreras para la entrada y persistencia de la en el pronóstico ecológico y de qué manera. Muchas veces los ciclos de pronóstico existentes centran los resultados de la investigación, dejando a la comunidad como una idea de último momento. Para que el pronóstico ecológico refleje mejor las comunidades con las que trabajamos, debemos estructurar nuestros ciclos de pronóstico para centrar los valores que son importantes para las comunidades a las que servimos.
Por ejemplo, en la reunión de Geoscience Alliance en 2022, dedicamos un tiempo considerable a discutir cómo las comunidades marginadas seguido no tienen acceso a Internet, hardware informático y herramientas de infraestructura cibernética que muchas veces se dan por hecho en la comunidad de pronósticos ecológicos (Comisión Federal de Comunicaciones, 2012), que corresponde a la parte B del ciclo de pronóstico iterativo y gestión adaptativa. La lista de barreras para la persistencia en el pronóstico ecológico rápidamente se volvió demasiado larga para una publicación de blog, ya que nos dimos cuenta de que el ciclo de pronóstico refleja las barreras sistémicas para la inclusión que persisten en el pronóstico ecológico y las ciencias ambientales cuantitativas en general. Esto llevó a la pregunta: ¿Podemos reimaginar un ciclo de pronóstico que incorpore la inclusión en toda la empresa de pronóstico?
Figura 1. Pronóstico ecológico iterativo y figura del ciclo de manejo adaptativo de Dietze et al. 2018.
LAS BARRERAS
Hipótesis: ¿Quién decide qué se pronostica y cómo?
Las hipótesis, tal como son imaginadas en el proceso científico occidental, se originan dentro de una epistemología específica, o forma de conocer y comprender. Sin embargo, hay muchas epistemologías, y sin compromiso con las comunidades, los pronósticos desarrollados y motivados por la literatura ecológica histórica estarán sesgados hacia lo que se ha estudiado históricamente y los enfoques probados y verdaderos de la investigación científica. En ecología como en muchas disciplinas científicas, la literatura histórica está dominada por hombres blancos. Además, los temas y estudios que han producido la mayor cantidad de datos y resultados positivos (Nakagawa et al. 2022), o los flujos de datos que producen datos consistentemente colectados, archivados y disponibles, serán los más representados y reforzados continuamente. Una alternativa son los pronósticos coproducidos, que centran los supuestos, el conocimiento y las ideas más valiosas para las necesidades de una comunidad (Nyadzi et al., 2022; Record et al., 2022).
De manera similar, la financiación refuerza las barreras perpetuas de entrada para las comunidades históricamente marginadas. Los fondos de investigación que recompensan continuamente la novedad y la vanguardia de la ciencia muchas veces no se alinean con las necesidades locales o comunitarias (Flagg, 2022; Van Horne et al., 2023), y muchas veces no hay incentivos para continuar trabajando con las comunidades locales en problemas persistentes después de que termine el ciclo de subvenciones. Además, los investigadores de grupos históricamente excluidos, muchas veces más conscientes de las necesidades locales o comunitarias o que trabajan en el Sur Global, tienen su trabajo publicado y exhibido menos que los científicos en las instituciones del Norte Global (Smith et al., 2023), perpetuando así las barreras para publicar y financiar investigaciones relacionadas con los problemas de la comunidad.
Modelos: ¿Quién genera el modelo y quién tiene acceso a los modelos y datos?
Los modelos son, por definición, simplificaciones de la verdad. Los aspectos de la verdad que se simplifican están inherentemente sesgados por aquellos que generan los modelos, y los modelos frecuentemente son desarrollados para reflejar la hipótesis de un investigador sobre cómo funciona un sistema. Cuantos más aspectos se omiten para crear un modelo de trabajo, más oportunidades existen para eliminar perspectivas y verdades entendidas por las personas marginadas. La generación de modelos está sujeta a las mismas debilidades epistemológicas que las hipótesis porque los modelos en muchos sentidos son nuestras hipótesis. Para los sistemas ecológicos, específicamente, los mecanismos son complejos, y la inclusión de la diversidad epistemológica se vuelve cada vez más importante para la comprensión contextual en sistemas tan complejos (Page, 2014). Importantemente, la comprensión mecanicista y las decisiones basadas en información producida en asociación entre epistemologías son más sólidas (Berkes, 2009; Schuttenberg y Guth, 2015; Wheeler y Root-Bernstein, 2020). Entonces, además del valor inherente de un proceso más inclusivo (Morrison y Steltzer, 2021; NASEM, 2022), incorporando diferentes perspectivas puede proporcionar una comprensión más holística y posiblemente más sólida de los sistemas naturales.
Además, la creación de los modelos que producen pronósticos está influenciada por quién tiene acceso para usar o ejecutar los modelos. No todos los modelos son de código abierto y muchos tienen un legado histórico de propiedad que puede dificultar que las personas nuevas en esta área aprendan a ejecutar un cierto modelo. Incluso los modelos que se pueden construir desde cero (por ejemplo, los modelos de regresión lineal) requieren conocimientos estadísticos que mayormente son inaccesibles para los académicos fuera de los entornos académicos intensivos en investigación.
La propiedad de los datos también puede ser una barrera para crear modelos de pronóstico. Por un lado, hay muchos conjuntos de datos de código abierto (por ejemplo, NEON). Sin embargo, estos datos pueden ser demasiado grandes para obtener acceso usando computadoras portátiles personales, los datos muchas veces no son colectados por las mismas maneras en todas las ubicaciones (p. ej., NEON), y los datos que se han colectado estarán sesgados hacia los intereses de quienes han configurado el proceso de coleccion. También hay casos en los que se debe considerar la soberanía de los datos (Vera et al., 2019) y en los que los datos deben mantenerse propietarios (p. ej., trabajar con datos culturalmente relevantes o sujetos humanos). De manera similar, ejecutar modelos y hacer pronósticos probabilísticos requiere acceso a recursos computacionales y experiencia. El entrenamiento cuantitativo básico no es universal ni creado igual (Willson et al., 2023).
Idioma
El uso del inglés como lingua franca en el contexto científico, impone barreras a quienes no son hablantes nativos del idioma en diferentes aspectos. Desde la dificultad para adquirir nuevos conocimientos en una lengua diferente a la materna, pasando por limitación de oportunidades de estudio y laborales, hasta sesgos de publicación y experiencias de discriminación en instituciones académicas (Woolston & Osorio 2019).
A lo largo del siglo XX se ha observado que el inglés pasó de ser parte de un modelo plurilingüe de comunicación científica internacional, en el que otros idiomas, como el francés y alemán también eran comúnmente utilizados, a tener un dominio casi absoluto en la comunicación de las ciencias naturales y sociales, lo que limita cómo y quiénes pueden comunicar ciencia e incluso aprenderla (Hamer, 2013; Amano et al 2021).
En el caso particular del Ecological Forecasting, al aprendizaje de tópicos complejos como la estadística, modelación matemática y programación, se añade la dificultad de hacerlo en inglés para hablantes ESL (English as a Second Language), ya que la mayoría de los textos, artículos y recursos de apoyo (e.g. foros, videos, tutoriales) están en este idioma (Amano et al. 2021). Prueba de ello es el repositorio que como Education Section de EFI hemos colectado, con materiales exclusivamente en inglés. Si bien esto está sesgado por la composición lingüística de nuestro grupo, es un reflejo de muchos tópicos en ciencias.
Si bien la enseñanza del idioma inglés suele estar en la currícula de la gran mayoría de países no angloparlantes desde la educación básica, y un 20% de la población global se encuentra estudiando inglés como segunda lengua (TEFL Academy 2020), la comprensión necesaria del idioma para poder aprender y producir predicciones ecológicas difícilmente puede ser garantizada para personas que no hayan recibido instrucción privada y vienen de contextos socioeconómicos privilegiados. Esto impone dificultades a las personas interesadas en investigación que no hablen inglés tanto para adquirir nuevos conocimientos como para hacer posgrados, colaboraciones de investigación y publicar en revistas internacionales (Woolston & Osorio 2019; Amano et al 2021).
HACER EXPLÍCITA LA INCLUSIÓN EN LOS CICLOS DE PRONÓSTICO
El ciclo de pronóstico que se muestra en la Figura 1 ha aparecido en diferentes iteraciones en estudios subsecuentes (por ejemplo, Moore et al. 2022). Hemos agregado dos “ciclos” de pronóstico alternativos, que se describen a continuación, a esta lista, con el objetivo de reducir las barreras a la inclusión. Mientras considerábamos figuras alternativas, preguntamos: “¿Cómo deben ser? ¿Debería ser un ciclo o algún otro modelo conceptual?” Las dos figuras que se presentan aquí deben considerarse como primeros borradores y dan algunos elementos de reflexión sobre las barreras a la inclusión en el proceso de pronóstico y cómo enfrentarlas. En el futuro, esperamos que el rediseño del marco de pronóstico ecológico pueda ser, en sí mismo, un proceso inclusivo. Presentamos figuras que representan los ciclos de pronóstico en este paquete de diapositivas, donde agradecemos las contribuciones adicionales de los lectores e invitamos a cualquier persona interesada a unirse a nuestros esfuerzos para escribir un manuscrito asociado con este proyecto.
Ciclo de Pronóstico Centrado en la Comunidad – Ejemplo 1
La ciencia se alaba mucho por su objetividad, pero cada hipótesis o pregunta conlleva sesgos inherentes que reflejan los valores, los procesos de pensamiento y las experiencias de los investigadores, como se discutió anteriormente en la sección Las Barreras. Estos valores se muestran cuándo se aplican los hallazgos científicos, como en la toma de decisiones basada en pronósticos, y el usuario final usualmente es diferente que el investigador, con diferentes valores, procesos de pensamiento, y experiencias. En el grupo de trabajo DEI de EFI, pensamos mucho en estas diferencias y en cómo unirlas para los objetivos comunes de mejorar la área de la predicción ecológica y promover la toma de decisiones ecológicas informadas. Reconocemos no solo el valor inherente de la inclusión (Morrison y Steltzer, 2021), sino también el beneficio que las diferentes experiencias y conocimientos pueden tener en una área emergente como el nuestro (Woelmer et al. 2021, Willson et al., 2023).1
Figura 2. Un intento imperfecto de visualizar un ciclo de pronóstico centrado en la diversidad. En este ciclo, ya sea que el objetivo final sea la comprensión sistémica o la toma de decisiones, los sesgos y objetivos del pronosticador se consideran explícitamente.
Con la inclusión en mente, creamos figuras como la Figura 2 para enfocar el ciclo de pronóstico dentro de una comunidad de práctica diversa. La Figura 2 enfatiza centrar los objetivos del proyecto dentro de los valores de los investigadores y usuarios finales (círculo azul). La ética, por lo tanto, no puede ser una idea de último momento: la evaluación y reevaluación continua de las metas, los valores y la ética debe ser un elemento de acción discreto. Estos sesgos luego se reconocen explícitamente como información del proceso científico (círculo rojo) y viceversa (flechas moradas). Importantemente, los que están involucrados en el esfuerzo de investigación de pronósticos pueden unirse al proceso desde el círculo azul o rojo, lo que demuestra las cualidades interdisciplinarias de los pronósticos. Y finalmente, las decisiones se pueden tomar sin ciencia, pero no se pueden tomar independientemente de los valores y sesgos personales (flechas negras internas).
El Tandy Center for Ocean Forecasting trabaja en el desarrollo de pronósticos para comunidades, industrias y otros usuarios. Al pensar en la inclusión, las personas del Centro Tandy están pensando en aquellas comunidades que se ven afectadas por los pronósticos que crean y las decisiones basadas en ellos. En el ciclo de pronóstico convencional (Figura 1), los científicos están centrados. Sin embargo, algunas de las lecciones que los pronosticadores de ecosistemas oceánicos han aprendido y han tenido la generosidad de compartir a lo largo de los años han tenido que ver con las consecuencias no deseadas y los daños accidentales causados por programas de pronóstico bien intencionados (Hobday et al., 2019). Ser pronosticador puede ser precario, y probablemente sea imposible evitar todos los escollos, pero con suerte, podemos aprender de algunas de estas lecciones. El Centro trabaja bajo la creencia de que ser más inclusivo puede ayudar a alinear las necesidades de las comunidades que usan, o se ven afectadas por, el pronóstico con el diseño del programa de pronóstico. El esquema que se incluye a continuación (Figura 3) proviene de la documentación de orientación del Tandy Center (Record, 2022). No es exactamente un ciclo, sino más como un mapa para guiar los diálogos con diferentes grupos comunitarios para que puedan colaborar en cada paso. También hay un video que recorre la figura. En resumen, las comunidades deben ser socios durante todo el proceso, contribuyendo al diseño del sistema. Al centrarnos en los usuarios de pronósticos en vez de los pronosticadores, esperamos ayudar a que el desarrollo de pronósticos sea más accesible y llegue a nuevas personas y lugares que podrían ser de bajos recursos o están excluidos de la corriente principal de las aplicaciones de pronósticos.
Figura 3. Diagrama esquemático del marco basado en los depositarios para construir sistemas de pronóstico (Registro 2022). Las flechas indican el movimiento bidireccional entre cualquiera de los componentes del marco, potencialmente varias veces.
Debilidades notables que aún permanecen
Por supuesto, incluir todo en una sola figura es un desafío (por eso la publicación de este blog). Discurso continuado sobre cómo afrontar las debilidades se comparte en Próximos Pasos. Además, las ideas más notables se han omitido o se les ha quitado énfasis en las figuras anteriores, pero se han discutido a lo largo de las reuniones del grupo de trabajo. Por ejemplo, los esfuerzos de diversidad, equidad, inclusión y justicia (DEIJ) se enumeran muchas veces en las solicitudes de subvenciones como impactos más amplios, pero no se considera que contribuyan al mérito intelectual. En la Tabla 1 se puede encontrar una lista más completa, que incluye algunas alternativas más inclusivas.
PRÓXIMOS PASOS
Pensando en los estudiantes
El legado de las barreras a la inclusión se ha llevado a cabo a través de la educación científica, y romper este legado debe incluir el pensamiento sobre la educación. Los estudiantes de hoy están muy motivados, ansiosos y listos para enfrentar asuntos generalmente definidos sobre diversidad, equidad, inclusión y justicia. Esta pasión se forma a partir de una variedad de experiencias e identidades. La buena educación y los enfoques pedagógicos están atentos de la diversidad de los alumnos (Harris et al., 2020; Miriti, 2019; Rawlings-Goss et al., 2018). La enseñanza toma muchas formas, pero puede consistir en (1) actividades de aprendizaje activas y colaborativas (Corwin et al., 2018; Graham et al., 2013), (2) proporcionar agencia y voz a los estudiantes (son co-creadores en los resultados) , (3) honrar los conocimientos existentes, (4) evitar el lenguaje deficitario al enseñar. Se pueden encontrar recursos adicionales para la enseñanza inclusiva en los Recursos de pedagogía inclusiva compilados por EFI, así como en esta extensa lista de recursos y estrategias de enseñanza inclusiva del Centro de Investigación sobre el Aprendizaje y la Enseñanza de la Universidad de Michigan. También hay esfuerzos dentro de la comunidad de EFI y el Grupo de Trabajo de Educación de EFI para compilar recursos educativos abiertos (Willson and Peters, 2021; Willson et al., 2023, Tabla 1), así como para desarrollar módulos educativos en colaboración con profesores de Instituciones al Servicio de las Minorías para enseñar herramientas de ciencia de datos que incorporan conocimientos ecológicos tradicionales y valores culturales.
Revertir la marginación
La ciencia de datos continúa teniendo tasas de representación tremendamente bajas de grupos históricamente excluidos y marginados. En consecuencia, los datos y las herramientas informáticas muchas veces se crean a partir de una visión limitada del mundo de prioridades, valores y prácticas (consulte la sección Las barreras para obtener más detalles). Cuando estas herramientas se utilizan en comunidades marginadas, muchas veces son limitadas a las interpretaciones, sesgos y nociones preconcebidas de los creadores de estas herramientas (David-Chavez y Gavin, 2018). Sin centrar el conocimiento, la experiencia y las perspectivas de los grupos marginados en la creación de estas herramientas, se convierten en herramientas de opresión, que promueven el borrado, la perpetuación de estereotipos, y la continuación de la violencia y el daño a las comunidades. Si queremos que el pronóstico ecológico se convierta en una herramienta para promulgar un cambio significativo y justo, tenemos que alterar estructuralmente nuestros métodos y prácticas de investigación a través de una lente de interseccionalidad para centrar las voces de las comunidades marginadas, convertirlas en líderes en la creación de herramientas, y coproducir modelos y herramientas con las comunidades (Crenshaw, 2014). En la Tabla 1, mostramos cómo las modificaciones estructurales a las prácticas de investigación pueden mejorar el compromiso con los grupos marginados, mostrando la transferencia de poder hacia el beneficio de la comunidad. Al animar a la comunidad de pronósticos a considerar cuidadosamente cómo desarrollar colaboraciones, esperamos que las investigaciones futuras centren y traigan las perspectivas de las personas históricamente excluidas.
¡Conéctate con nosotros!
El desarrollo de esta publicación ha sido un proceso de aprendizaje para todo el grupo de trabajo EFI DEI y reconocemos que se trata de un proceso continuo e iterativo en el que es importante escuchar voces adicionales y seguir aprendiendo. Esperamos que esta publicación pueda ayudar a la comunidad científica y de EFI a seguir pensando en las barreras para participar en la predicción y las ciencias ambientales y las soluciones para superar esas barreras. Damos la bienvenida a los comentarios, sugerencias y reacciones sobre estas ideas presentadas. Nuestro objetivo es convertir esta publicación en un manuscrito que se base en estas ideas e invitamos a cualquier persona que desee compartir comentarios o participar como coautor en el esfuerzo del manuscrito a comunicarse con nosotros en los comentarios a continuación, en info@ecoforecast.org, en el canal #inclusion del grupo EFI Slack, o a través de Twitter (@eco4cast).
Tabla 1. Esta tabla proporciona una lista de diferentes temas relacionados con el pronóstico (y la ciencia de datos y la ciencia en general) que demuestran cómo las modificaciones estructurales a las prácticas de investigación pueden mejorar la inclusión de grupos históricamente marginados. Las tres columnas representan situaciones en las que hay mayor margen de mejora para conectar y centrar a los grupos marginados, en las que hay espacio para mejorar, y una columna con situaciones que son más beneficiosas para la mayoría de las personas. Es importante señalar que esta tabla está escrita como una generalización, y todas las prácticas de investigación en un proyecto deben decidirse en colaboración con la comunidad y estar alineadas con sus valores. Esta tabla se inspiró en The Wheel of Power and Privilege y otros trabajos relacionados (Jerarquía de datos indígenas, Global Indigenous Data Alliance y modelos para descolonizar la investigación científica, por ejemplo, David-Chavez 2019, David-Chavez et al. 2020). También puede ver un PDF de la Tabla AQUÍ.
Tema
Situaciones con mayor margen de mejora
Situaciones con espacio para mejorar
Situaciones que son las más beneficiosas y funcionan para centrar y atraer a las personas
Participación de la comunidad
– La investigación se realiza en comunidades sin contribuciones o con contribuciones limitadas de la comunidad – Los dólares de investigación no están dirigidos a la comunidad – Los investigadores son desconocidos a la comunidad
– Coproducción de conocimiento entre investigadores y la comunidad – Los dólares de investigación se distribuyen para trabajar con la comunidad – Los investigadores incluyen miembros de la comunidad – Reconocer y afrontar los impactos generacionales y a largo plazo
– Comunidades marginadas dirigen iniciativas de investigación – Los dólares de investigación van directamente a los grupos marginados – Los miembros de la comunidad son IPs en proyectos de investigación – La investigación involucra a niños y jóvenes en el desarrollo y ejecución de proyectos
Educación
– Prácticas educativas eurocéntricas – El valor se asigna solo a la programación con credenciales – Programas limitados a instituciones R1 y principalmente instituciones blancas – El alto costo de la matrícula es inaccesible – Los materiales mayormente se presentan sólo en inglés
– La educación enfatiza diferentes culturas y valores – Mejor acceso a la educación superior – Programas disponibles para instituciones públicas, comunitarias y tribales – Inclusión de materiales bilingües
– El material del plan de estudios es culturalmente informado y relevante – Reconocimiento del impacto de los programas no acreditados – Improving access to credentialed/advanced degree programs – Mejorar el acceso a programas acreditados/de grado avanzado – Los programas educativos abarcan el espectro de la educación (K-12 hasta programas de posgrado) para promover el aprendizaje generacional – Proporciona educación fuera de las instituciones académicas – Conocimientos ecológicos tradicionales incorporados en la educación – Los materiales se crean y traducen en los varios idiomas usados por la comunidad
Beneficios y daños
– Usar herramientas o datos que mal representan una comunidad – La ciencia se lleva a cabo sobre personas sin consentimiento – Perpetuación de la violencia, el daño y el borrado de grupos marginados – Las comunidades y las personas son consideradas como una idea de último momento en los proyectos – Los valores se centran en los ideales occidentales – No reconoce a las comunidades de donde proviene la investigación
– La ciencia se lleva a cabo con el consentimiento de la comunidad pero sin sus contribuciones en el diseño – La investigación proporciona conocimiento a la comunidad – Prioriza y centra las comunidades más privilegiadas o las comunidades más representadas – Reconocimientos de tierras reconocen el legado de la colonización
– Trabajando en ciencia en conjunto con las comunidades para beneficiar a las comunidades – Dar agencia a las comunidades marginadas para definir y tener acceso a la investigación – Centra a las personas y las comunidades en los proyectos – Los valores se centran en los ideales de las comunidades – Devolución de tierras, o los reconocimientos de tierras reconociendo el daño y el beneficio continuos para la institución
Computación y Tecnología
– Requerir suscripciones para software – Opciones limitadas de entrenamiento – Acceso computacional y a internet limitado
– Uso de herramientas accesibles y de bajo costo – Proporcionar acceso a computadoras o dispositivos móviles – Uso del diseño universal en materiales
– Recursos desarrollados para personas sin acceso a Internet en mente – Se utilizan o generan materiales de código abierto – Los recursos computacionales son fácilmente accesibles
Disponibilidad de datos (incluidas revistas y herramientas)
– Los datos solo están disponibles a través del acceso privado o detrás de un muro de pago – Las comunidades y los individuos no pueden controlar los datos o el acceso de datos – Requiere software especializado, herramientas, y conocimiento de dónde acceder a los dato – Datos colectados sin el consentimiento de la comunidad o los individuos
– Datos disponibles por solicitud en lugar de acceso abierto en línea – Los datos y las herramientas se publican para compartir en futuras investigaciones y colaboraciones – Los datos son colectados con el conocimiento y consentimiento de la comunidad
– Promueve el uso ético de los datos – Reconoce y apoya la soberanía de datos – Amplia educación sobre cómo obtener acceso a herramientas, recursos y datos – Datos colectados con respecto a los valores y prácticas culturales – Mejora la facilidad de acceso a datos públicos – Los datos se abren según los deseos y necesidades de la comunidad
Diversidad y Justicia
– Equipos de investigacion homogéneos en terminos de raza o cultura – La investigación perpetúa el daño a los grupos marginados o mantiene el statu quo – La financiación se enfoca en los impactos a corto plazo – Los proyectos finalizan cuando finaliza la financiación
– Los investigadores trabajan con estudiantes de orígenes diversos – Mejora la representación de los grupos marginados en los espacios de investigación
– Equipos diversos con agencia – La investigación promulga un cambio social significativo – La financiación y la investigación reconocen la importancia de los impactos a largo plazo – La implementación del proyecto continúa después de que finaliza la financiación
Citations
Amano, T., Rios Rojas, C., & Boum, I. I. Y, Calvo M, Misra BB. 2021. Ten tips for overcoming language barriers in science. Nature Human Behaviour, 5(9), 1119-1122.
Berkes, F., 2009. Indigenous ways of knowing and the study of environmental change. J. R. Soc. N. Z. 39, 151–156. https://doi.org/10.1080/03014220909510568
Corwin, L.A., Prunuske, A., Seidel, S.B., 2018. Scientific presenting: Using evidence-based classroom practices to deliver effective conference presentations. CBE Life Sci. Educ. 17, es1. https://doi.org/10.1187/cbe.17-07-0146
Crenshaw, K. 2014. On Intersectionality: Essential writings. The New Press.
David-Chavez, D.M., Gavin, M.C., 2018. A global assessment of Indigenous community engagement in climate research. Environ. Res. Lett. 13, 123005. https://doi.org/10.1088/1748-9326/aaf300
David-Chavez DM. 2019. A guiding model for decolonizing environmental science research and restoring relational accountability with Indigenous communities (Doctoral dissertation, Colorado State University).
David-Chavez DM, Valdez S, Estevez JB, Meléndez Martínez C, Garcia Jr AA, Josephs K, Troncoso A. Community-based (rooted) research for regeneration: understanding benefits, barriers, and resources for Indigenous education and research. AlterNative: An International Journal of Indigenous Peoples. 2020 Sep;16(3):220-32.
Flagg, M., 2022. Reward research for being useful — not just flashy. Nature 610, 9–9. https://doi.org/10.1038/d41586-022-03131-7
Graham, M.J., Frederick, J., Byars-Winston, A., Hunter, A.-B., Handelsman, J., 2013. Increasing Persistence of College Students in STEM. Science 341, 1455–1456. https://doi.org/10.1126/science.1240487
Hamel, R. E. 2013. El campo de las ciencias y la educación superior entre el monopolio del inglés y el plurilingüismo: elementos para una política del lenguaje en América Latina. Trabalhos em linguística aplicada, 52, 321-384.
Harris, B.N., McCarthy, P.C., Wright, A.M., Schutz, H., Boersma, K.S., Shepherd, S.L., Manning, L.A., Malisch, J.L., Ellington, R.M., 2020. From panic to pedagogy: Using online active learning to promote inclusive instruction in ecology and evolutionary biology courses and beyond. Ecol. Evol. 10, 12581–12612. https://doi.org/10.1002/ece3.6915
Hobday, A.J., Hartog, J.R., Manderson, J.P., Mills, K.E., Oliver, M.J., Pershing, A.J., Siedlecki, S., 2019. Ethical considerations and unanticipated consequences associated with ecological forecasting for marine resources. ICES J. Mar. Sci. 76, 1244–1256. https://doi.org/10.1093/icesjms/fsy210
Martínez-Blancas, A., Bender, A., Zepeda, V., McGuire, R., Tabares, O., Amarasekare, P., Mastretta-Yanes, A., Miriti, M., Santos, A.M.C., Vaz, M.C., 2023. Surviving Racism and Sexism in Academia: Sharing Experiences, Insights, and Perspectives. Bull. Ecol. Soc. Am. 104, e02033. https://doi.org/10.1002/bes2.2033
Miriti, M.N., 2019. Nature in the eye of the beholder: A case study for cultural humility as a strategy to broaden participation in STEM. Educ. Sci. 9, 291. https://doi.org/10.3390/educsci9040291
Moore TN, Thomas RQ, Woelmer WM, Carey CC. Integrating Ecological Forecasting into Undergraduate Ecology Curricula with an R Shiny Application-Based Teaching Module. Forecasting. 2022 Jun 30;4(3):604-33.
Morrison, D.L., Steltzer, H., 2021. Diverse values, philosophies and ideas beget innovation and resilience in ecology and for our world. Ecol. Appl. 31, e02351. https://doi.org/10.1002/eap.2351
National Academies of Sciences, Engineering, and Medicine (NASEM), 2022. Next Generation Earth Systems Science at the National Science Foundation. National Academies Press, Washington, D.C. https://doi.org/10.17226/26042
Nakagawa, S., Lagisz, M., Jennions, M. D., Koricheva, J., Noble, D. W. A., Parker, T. H., Sánchez-Tójar, A., Yang, Y., & O’Dea, R. E. 2022. Methods for testing publication bias in ecological and evolutionary meta-analyses. Methods Ecol. Evol. 13, 4– 21. https://doi.org/10.1111/2041-210X.13724
Nyadzi, E., Werners, S.E., Biesbroek, R., Ludwig, F., 2022. Towards weather and climate services that integrate indigenous and scientific forecasts to improve forecast reliability and acceptability in Ghana. Environ. Dev. 42, 100698. https://doi.org/10.1016/j.envdev.2021.100698
Page, S.E., 2014. Where diversity comes from and why it matters? Eur. J. Soc. Psychol. 44, 267–279. https://doi.org/10.1002/ejsp.2016
Rawlings-Goss, R., Cassel, L. (Boots), Cragin, M., Cramer, C., Dingle, A., Friday-Stroud, S., Herron, A., Horton, N., Inniss, T.R., Jordan, K., Ordóñez, P., Rudis, M., Rwebangira, R., Schmitt, K., Smith, D., Stephens, S., 2018. Keeping data science broad: Negotiating the digital and data divide among higher education institutions. Workshop Bridg. Digit. Data Divide.
Record, N.R., Evanilla, J., Kanwit, K., Burnell, C., Cartisano, C., Lewis, B.J., MacLeod, J., Tupper, B., Miller, D.W., Tracy, A.T. and White, C., 2022. Benefits and Challenges of a Stakeholder-Driven Shellfish Toxicity Forecast in Coastal Maine. Frontiers in Marine Science, p.1031.
Record, N., 2022. Early Warning Systems for Harmful Algae: A Stakeholder-Centered Framework. https://doi.org/10.13140/RG.2.2.24501.14568
Schuttenberg, H.Z., Guth, H.K., 2015. Seeking our shared wisdom: a framework for understanding knowledge coproduction and coproductive capacities. Ecol. Soc. 20(1). http://www.jstor.org/stable/26269755
Van Horne, Y.O., Alcala, C.S., Peltier, R.E., Quintana, P.J.E., Seto, E., Gonzales, M., Johnston, J.E., Montoya, L.D., Quirós-Alcalá, L., Beamer, P.I., 2023. An applied environmental justice framework for exposure science. J. Expo. Sci. Environ. Epidemiol. 33, 1–11. https://doi.org/10.1038/s41370-022-00422-z
Vera, L.A., Walker, D., Murphy, M., Mansfield, B., Siad, L.M., Ogden, J., 2019. When data justice and environmental justice meet: formulating a response to extractive logic through environmental data justice. Inf. Commun. Soc. 22, 1012–1028. https://doi.org/10.1080/1369118X.2019.1596293
Wheeler, H.C., Root-Bernstein, M., 2020. Informing decision-making with Indigenous and local knowledge and science. J. Appl. Ecol. 57, 1634–1643. https://doi.org/10.1111/1365-2664.13734
Willson, A., Peters, J. Ecological Forecasting Repository of Online Educational Resources. https://doi.org/10.25334/XAW7-JW16
Translational ecology aims to increase the usability of knowledge and products beyond scientific communities by integrating socio-environmental knowledge and stakeholders or end users as partners in the process and projects. For the past few months, the Translation and Actionable Science Working Group has been working to gauge the translational needs of the EFI community and to identify where modelers and physical scientists see gaps in connecting to stakeholders and end users to conduct translational research. The goal of this post is to share what the working group has identified as priorities for translational needs and share where there are connections to what other working groups and organizations are doing.
Michael Gerst (University of Maryland) led interviews in October-November 2022 with nine individuals across EFI that represent a range of early to late career stages, institutional type (academic, NGO, U.S. government agency), and gender to learn about interviewees’ experiences with forecasting projects that required stakeholder interaction, what went well, what didn’t, and what would have been useful to improve stakeholder engagement. The EFI Translation Working Group is using the results from these interviews to prioritize and develop activities that can help to fill those gaps.
The following seven topics were identified from the interviews and Working Group discussions that could be developed into self-contained seminars, manuals, or guidance documents (for short-term activities) or hosting larger workshops or proposal writing opportunities (for longer-term activities). Cases where topics overlap with other EFI working group discussions and activities are also highlighted.
How can EFI serve as an advocate for ecological forecasting to stakeholder groups, especially the public sector? In some cases, the individuals interviewed found that the stakeholders they work with were not interested as much in the forecasts provided as they were in the real-time data that was provided during the data collection and forecast process. These real-time data allowed the stakeholders to use their expert knowledge to make informed decisions that may or may not have been related to the forecasts that the teams provided. Within academia, there has been quite a bit of work to raise the profile of ecological forecasting, but there is now the opportunity to bring this awareness outside academia to private and government sectors to both promote the benefits of ecological forecasts in settings outside academia and listen to the needs of stakeholders.
What’s the appropriate level of stakeholder engagement? Is co-production always the right answer? Co-production is increasingly seen as a method for improving the fit between science and stakeholder needs. However, it can be time-consuming and expensive, necessitating assessment of whether its potential benefits are a good match for a project. While understanding of the contexts in which co-production can be fruitful has improved, there is still a gap in distilling guidelines for scientists on when it is appropriate, and if not, what other options exist.
How to help colleagues find collaborators across disciplines (i.e., matchmaking) as well as providing guidance on what makes a fruitful multi-disciplinary collaboration? This topic, as well the previous point about the appropriate level of stakeholder engagement connects with conversations and a blog post the EFI Diversity, Equity, and Inclusion (DEI) working group is having and developing that highlights the need to bring in collaborators at the beginning of a project to learn what is of most interest to them. The DEI group has focused on underrepresented individuals in terms of race/gender, but this can also be applicable to underrepresented disciplines in ecological forecasting like social science. This topic also connects with previous discussions in the former Partners and Knowledge Translation working group (which merged with the former Social Science group to become the current Translation working group). Previous discussions have revolved around how to keep a database of individuals and groups that support matchmaking connections. The group has also discussed the need for forums or meetings to allow groups to pitch ideas and socialize early ideas that can then be followed up to develop proposals to fund those ideas. Clearly, this is something that resonates both within the working groups and across the broader EFI community.
How to initiate, foster, and maintain stakeholder relationships? In 2021 and early 2022 the Partners and Knowledge Transfer and Social Science working groups hosted a number of seminars on science communication and co-production. In particular, the May 4, 2021 seminar on co-production provides some initial resources that could be built out further for this topic. The discussions and the upcoming blog post the EFI DEI working group is developing that highlight ways to connect to underrepresented groups will also provide useful resources related to fostering relationships.
How to understand stakeholder decision-making processes? In the interviews, a few anecdotes were shared that ultimately can be summarized as: we thought we knew how stakeholders make decisions (with forecasts!) but experience eventually proved otherwise. In addition to learning the process of stakeholder engagement, interviewees thought there would be utility in helping modelers understand the universe of ways stakeholders might make decisions and where forecasts fit in (or don’t!).
How to set up extended project planning to ensure continued operationalization? It is important to have a plan in place for how ecological forecasts will be operationalized after the initial set of funding expires. Stakeholders are frustrated if they start to use a forecast and then it is no longer available when the funding is over. NASA provides one example of how to avoid this issue. In NASA’s Ecological Conservation Applications, solicitations (e.g., A.40 Earth Science Applications: Ecological Conservation) often require proposal teams to include partners/end users who will also be responsible for maintaining the ecological forecasting products (e.g, web apps) beyond the NASA funding period.
How to make data, models, and systems that are documented and reusable (FAIR data, models)?This is a topic that is of interest across multiple working groups in the EFI community. The Forecasting Standards working group has recently submitted a manuscript for publication titled “A Community Convention for Ecological Forecasting: Output Files and Metadata.” The preprint is available here: https://ecoevorxiv.org/9dgtq/. The manuscript focuses on suggestions for documenting ecological forecasts. The Cyberinfrastructure and Methods working group has also been thinking about the issue where groups creating ecological forecasts continue to develop one-off or boutique workflows. That working group is writing a workshop proposal to bring the together people from government agencies, industry, NGOs, and academia together to develop a way to share forecasts and workflows so people don’t need to reinvent a forecast workflow. Instead, new forecasts can be created that borrow strength from resources already developed for similar models or workflows and instead be able to focus on the details and nuances of applying a forecast in their own study system or domain. This also resonates with what the EFI NEON Ecological Forecasting Challenge is working on with the cyberinfrastructure that is set up for accessing target and meteorological data and accepting, scoring, and visualizing forecasts across multiple NEON Data streams.
Below is the list of poster and oral presentations for EFI’s hosted session at the American Geophysical Union (AGU) 2022 Conference in Chicago, as well as other ecological forecasting-related talks that may be of interest to the community. All times are listed in US Central Time.
Thursday EFI Social – Anyone who is available to meet up on December 15, Thursday evening, we’ll have a group getting together at Kroll’s South Loop starting around 6:30 – 8:30pm. It’s an 18-minute walk from the Convention Center. Find directions here.
Friday Poster and Oral Sessions – EFI’s oral and poster sessions on “Ecological Forecasting in the Earth System” will be held on Friday, December 16, 2012. The in-person Poster Session is from 9am-12:30pm in Poster Hall A (South, Level 3). The Online Poster Session is from 1:45-2:45pm. The Oral session is from 4:45-6:15pm in S501bcd (South, Level 5). We’re excited to have a great set of speakers that really span the full gradient from terrestrial to freshwater to marine. Come check out the following talks!
The EFI Partner’s Working Group hosted Pablo Suarez on November 19 for an intensely participatory Zoom call session titled “Serious Fun: Reimagining Virtual Events on Ecological Forecasting”. This was the first of a 2-part series on science communication. The second session, “Sharing is Caring: Communicating Science Beyond Academic Publications” will be held on January 19. You can find details and register for the January session here.
The first session on November 19 was not recorded due to the intensely participatory nature of the call. However, below we share an overview of the call and resources shared by Pablo.
Pablo Suarez is innovation lead at the Red Cross Red Crescent Climate Centre, a visiting fellow at Boston University, and an artist in residence at the National University of Singapore. He directs the Climate Centre’s initiatives linking applied knowledge with humanitarian work, as well as new approaches to climate risk management. Examples of his work include participatory games for learning about climate change and dialogue, and forecast-based financing pilots in Togo and Uganda.
Pablo started with the premise that disasters are collaborating better than humans are – for example, things like the pandemic, climate issues, and conflicts are exponentially causing harm and we need to have better collaborations between those who know and those who do. And if we want to effectively work with other scientists, people impacted by what we study, or policymakers, we need to let people know how much we care about what they care about. Often we convey information and work to develop collaborations through meetings and presentations typically with a keynote or series of talks followed by a short Q&A session. Pablo advocated that there are better ways to communicate and develop collaborations during meetings and conferences and that is by using games and including humor and spontaneity as a way to broaden engagement and make connections.
As I worked with Pablo to coordinate the logistics for the call and compile the advertising material, I didn’t grasp what the “Serious Fun” part of his talk title meant. But after participating on the call, I am inspired to think about ways to incorporate his suggestions for reimagining virtual events which are low-carbon and low-budget compared to in-person events. We know Zoom fatigue is real, but by including spontaneity, humor, and games, virtual events can be more engaging and can lead to deepened networks and collective action. By having fun, we can be more effective at conveying serious ideas about science, ecological forecasting, and making decisions.
Below I describe the two major activities held during the call and end with a list of the resources Pablo shared.
1. Rant
One group activity was called Rant. Early on in the call, we had a short amount of time to write out all our frustrations with Zoom calls. It was fast-paced and Pablo really encouraged us to get into the Rant by expressing our frustrations through things like capitalization, exclamation marks, etc. Later after other activities in the call, we had the opportunity to go back to rants submitted by ourselves and by others on the call to think about changes that could be made to alleviate issues with Zoom calls. You can see a few example rants and changes below and you can find all the rants here. I particularly appreciated the second example below, since that was my rant.
2. Decisions for Seasons
The other major activity Pablo facilitated was a version of Decisions for Seasons, a game designed to support learning and dialogue about key aspects of planning for extremes and experiencing climate change impacts and managing risk. In this game, everyone had 10 forecasts about the climate conditions for the next year. We could choose if the conditions would be regular/normal (thumbs up) or if we should plan for drought insurance (buckets) or flood insurance (umbrellas). This game was also fast-paced with only about a minute to make these decisions. After everyone had made their predictions about the future conditions, Pablo rolled a die where a 1 meant there was a drought and a 6 meant there was a flood and we all hoped we had picked enough drought or flood insurance to handle those rolls! The fun part was then seeing whose predictions were correct and who ended up getting broken hearts for incorrect predictions (see the second image below). Although we didn’t have time during our call, an extension to this game is to incorporate climate change by using an 8-sided die where floods become represented by a 6, 7, or 8 increasing the chance of an extreme event. You can find more details about how this game can be played here.
Screenshot from GoodGames “Decisions for Seasons” game showing options for investing to plan for next year’s conditions.
Screenshot example of the results from the game after 10 rolls of a die
Throughout the call we had fun, there were moments of heart-racing tension to get our predictions and answers in, there were opportunities for competition and collaboration, and plenty of joy. But there was also a seriousness moving forward to think about what we are doing with forecasts, how we can improve forecasts, how we can improve people’s access, understanding, and opportunity to act, and how we can enable people to make decisions with forecasts.
While this seminar focused on how to make virtual events more engaging, Pablo’s suggestions and resources can also be applied to in-person conferences and meetings, classes, and lab meetings. Let’s have more fun, let’s be more engaged!
Resources
For those interested in exploring how to incorporate games into your presentations and to find ways to make your audiences know you care about what they care about, the following are resources Pablo shared during the call.
The Climate Centre’s website has lots of resources (climatecentre.org). In particular, there is a section about humour and a number of climate games.
There are almost 30 climate games applicable for small to large groups (n=6-100) and that cover a range of topics including climate change adaptation and mitigation, collaboration, disaster risk reduction, health, resilience, etc. Each game includes learning objectives, intended audiences, required materials, and pdf and video tutorials. A number of the games specifically connect to forecasting and decision making incuding the Decisions for Seasons game we played during the call. Two other examples include
Before the Storm – a decision-making game designed to introduce weather forecasts and possible actions to take against natural disasters through different roles.
Paying for Predictions – a participatory activity to experience the impacts of climate change, to understand the value of forecasts and to enhance the understanding of climate smart disaster risk reduction.
Pablo used the GoodGames platform during our call for the Rant and Decisions for the Season activities. The Decisions for the Season can be played in person with the instructions linked on the Climate Centre’s website, but GoodGames has also made an online version here. You can learn more about GoodGames here: https://gg.goodfocus.net/about/. The games do cost money, but if this was something you or your organization were interested in, it would be worth checking in with GoodGames. I believe their are discounts for those in non-profits.
Post by: The EFI Diversity, Equity, and Inclusion Working Group
The Ecological Forecasting Initiative, like many other organizations, calls for justice for George Floyd and countless other Black individuals and persons of color, and we stand in solidarity with our Black colleagues and friends saying #BlackLivesMatter. Our EFI Diversity, Equity, and Inclusion (DEI) Working Group is committed to listening, learning, and exploring ways to promote anti-racism and to make EFI, and STEM fields more broadly, a welcoming environment. In regards to ecological forecasting, as a first step, we need the input and experience from people of all backgrounds at all stages of the ecological forecasting process, from forecast development and implementation to stakeholder decisions. Ecological forecasting as a field is relatively new; creating an inclusive, anti-racist field starts with understanding the lived experiences of all types of forecasters, end-users, and community stakeholders. We have more in-depth initiatives and tasks associated with the current NSF funded EFI-RCN grant and other proposals submitted for review, but for now, the following are four ways we invite you to get involved by joining the group, using or adding to our Bibliography of resources, filling out a short 5-minute survey, or joining our book club.
ONE Of all the EFI Working Groups, our DEI Group has the smallest number of participants. We welcome anyone who is interested in participating to learn more about ways to expand diversity and inclusion as well as brainstorming ways to increase diversity within the ecological forecasting field. Our next call is June 30 and upcoming monthly meetings are posted on the EFI’s DEI webpage, as is our Strategic Plan, which is a living document that provides an overview of the steps the DEI Working Group is taking to promote diversity, accessibility, and inclusion in EFI. Email eco4cast.initiative@gmail.com to be added to the mailing list for this group.
TWO If you are not able to join the Working Group calls at this time, there are additional ways to get involved. We are compiling a Bibliography that provides resources for learning more about anti-racism and the diversity status of fields relevant to ecological forecasting. These resources include lists of minority supporting associations, links to diversity and inclusion plans from professional societies, blog posts, publications, and compiled lists of resources from other organizations. This is also a living document, to which we will add additional documents moving forward. If there are additional resources you have found useful, they can be submitted through this Google form.
THREE As part of Step 1 of our Strategic Plan, “Identify and clarify the problem”, we are working to identify the current status of diversity within fields relevant to ecological forecasting as a baseline to assess the current status of diversity within the Ecological Forecasting Initiative, specifically. Once we assess the current diversity status of EFI, our next goal is to provide suggestions to ecological forecasting labs about ways to recruit more diverse students into our undergraduate and graduate programs. To assess the current status of diversity within fields relevant to ecological forecasting we are using the NSF funded NCSES Interactive Data Tool IPEDS database of the racial and ethnic backgrounds of students that have graduated from US institutions in over 400 academic programs. We have narrowed down the list to 29 academic degrees and are asking for your help to rank the relevance of these degrees to ecological forecasting in this short survey (https://nd.qualtrics.com/jfe/form/SV_3Pdyo1bh5OG8R93). Once we know which academic degrees are most relevant to ecological forecasting, we can assess the current diversity of those degrees relative to EFI. We will then work on Step 2 of our Strategic Plan, “Identify barriers that may prevent students from underrepresented groups from participating in ecological forecasting.”
FOUR To encourage open, honest conversation and anti-racist thinking, EFI will host its first virtual book club. We will begin with The Years That Matter Most: How College Makes or Breaks Us by Paul Tough. Tough’s book explores privilege in higher education, from the application process to the classroom. As many forecasters are educators and participants in higher education, we believe this book will serve the interests of EFI’s mission while helping participants grow in anti-racist values. The book club is open to all participants, regardless of EFI membership, race, ethnicity, gender, religion, or any other personal identity – we ask only that you participate with an open mind and a willingness for vulnerability. For those who would like to participate but need help acquiring the book, we have a limited amount of financial assistance available. Email eco4cast.initiative@gmail.com for more info. Logistics: The book club will meet weekly, in the evenings, starting the week of July 13th, with about 40-70 pages of reading per meeting (although meeting frequency and page counts can be adjusted to meet the needs of the group). If you are interested in participating, email eco4cast.initiative@gmail.com so we can send you the doodle poll to find a day/time for the group to meet.
EFI Member Nick Record (Bigelow Laboratory for Ocean Sciences) led an effort with Jaime Ashander (Resources for the Future), Peter Adler (Utah State University), and Michael Dietze (Boston University) to write a guest post titled “Ecological forecasting ethics: lessons for COVID-19” for Dynamic Ecology|Multa novit vulpes.