
May 23, 2024
Fullscreen ModeCategory Archives: Social Science
Translation Needs for the EFI Community
February 2, 2023
By the Translation Working Group
Translational ecology aims to increase the usability of knowledge and products beyond scientific communities by integrating socio-environmental knowledge and stakeholders or end users as partners in the process and projects. For the past few months, the Translation and Actionable Science Working Group has been working to gauge the translational needs of the EFI community and to identify where modelers and physical scientists see gaps in connecting to stakeholders and end users to conduct translational research. The goal of this post is to share what the working group has identified as priorities for translational needs and share where there are connections to what other working groups and organizations are doing.
Michael Gerst (University of Maryland) led interviews in October-November 2022 with nine individuals across EFI that represent a range of early to late career stages, institutional type (academic, NGO, U.S. government agency), and gender to learn about interviewees’ experiences with forecasting projects that required stakeholder interaction, what went well, what didn’t, and what would have been useful to improve stakeholder engagement. The EFI Translation Working Group is using the results from these interviews to prioritize and develop activities that can help to fill those gaps.
The following seven topics were identified from the interviews and Working Group discussions that could be developed into self-contained seminars, manuals, or guidance documents (for short-term activities) or hosting larger workshops or proposal writing opportunities (for longer-term activities). Cases where topics overlap with other EFI working group discussions and activities are also highlighted.
- How can EFI serve as an advocate for ecological forecasting to stakeholder groups, especially the public sector?
In some cases, the individuals interviewed found that the stakeholders they work with were not interested as much in the forecasts provided as they were in the real-time data that was provided during the data collection and forecast process. These real-time data allowed the stakeholders to use their expert knowledge to make informed decisions that may or may not have been related to the forecasts that the teams provided. Within academia, there has been quite a bit of work to raise the profile of ecological forecasting, but there is now the opportunity to bring this awareness outside academia to private and government sectors to both promote the benefits of ecological forecasts in settings outside academia and listen to the needs of stakeholders.
- What’s the appropriate level of stakeholder engagement? Is co-production always the right answer?
Co-production is increasingly seen as a method for improving the fit between science and stakeholder needs. However, it can be time-consuming and expensive, necessitating assessment of whether its potential benefits are a good match for a project. While understanding of the contexts in which co-production can be fruitful has improved, there is still a gap in distilling guidelines for scientists on when it is appropriate, and if not, what other options exist.
- How to help colleagues find collaborators across disciplines (i.e., matchmaking) as well as providing guidance on what makes a fruitful multi-disciplinary collaboration?
This topic, as well the previous point about the appropriate level of stakeholder engagement connects with conversations and a blog post the EFI Diversity, Equity, and Inclusion (DEI) working group is having and developing that highlights the need to bring in collaborators at the beginning of a project to learn what is of most interest to them. The DEI group has focused on underrepresented individuals in terms of race/gender, but this can also be applicable to underrepresented disciplines in ecological forecasting like social science.
This topic also connects with previous discussions in the former Partners and Knowledge Translation working group (which merged with the former Social Science group to become the current Translation working group). Previous discussions have revolved around how to keep a database of individuals and groups that support matchmaking connections. The group has also discussed the need for forums or meetings to allow groups to pitch ideas and socialize early ideas that can then be followed up to develop proposals to fund those ideas. Clearly, this is something that resonates both within the working groups and across the broader EFI community.
- How to initiate, foster, and maintain stakeholder relationships?
In 2021 and early 2022 the Partners and Knowledge Transfer and Social Science working groups hosted a number of seminars on science communication and co-production. In particular, the May 4, 2021 seminar on co-production provides some initial resources that could be built out further for this topic. The discussions and the upcoming blog post the EFI DEI working group is developing that highlight ways to connect to underrepresented groups will also provide useful resources related to fostering relationships.
- How to understand stakeholder decision-making processes?
In the interviews, a few anecdotes were shared that ultimately can be summarized as: we thought we knew how stakeholders make decisions (with forecasts!) but experience eventually proved otherwise. In addition to learning the process of stakeholder engagement, interviewees thought there would be utility in helping modelers understand the universe of ways stakeholders might make decisions and where forecasts fit in (or don’t!).
- How to set up extended project planning to ensure continued operationalization?
It is important to have a plan in place for how ecological forecasts will be operationalized after the initial set of funding expires. Stakeholders are frustrated if they start to use a forecast and then it is no longer available when the funding is over. NASA provides one example of how to avoid this issue. In NASA’s Ecological Conservation Applications, solicitations (e.g., A.40 Earth Science Applications: Ecological Conservation) often require proposal teams to include partners/end users who will also be responsible for maintaining the ecological forecasting products (e.g, web apps) beyond the NASA funding period.
- How to make data, models, and systems that are documented and reusable (FAIR data, models)?This is a topic that is of interest across multiple working groups in the EFI community. The Forecasting Standards working group has recently submitted a manuscript for publication titled “A Community Convention for Ecological Forecasting: Output Files and Metadata.” The preprint is available here: https://ecoevorxiv.org/9dgtq/. The manuscript focuses on suggestions for documenting ecological forecasts. The Cyberinfrastructure and Methods working group has also been thinking about the issue where groups creating ecological forecasts continue to develop one-off or boutique workflows. That working group is writing a workshop proposal to bring the together people from government agencies, industry, NGOs, and academia together to develop a way to share forecasts and workflows so people don’t need to reinvent a forecast workflow. Instead, new forecasts can be created that borrow strength from resources already developed for similar models or workflows and instead be able to focus on the details and nuances of applying a forecast in their own study system or domain. This also resonates with what the EFI NEON Ecological Forecasting Challenge is working on with the cyberinfrastructure that is set up for accessing target and meteorological data and accepting, scoring, and visualizing forecasts across multiple NEON Data streams.
The Integration of Ecological Forecasts Into Environmental Policy
Date: July 14, 2021
Post by: Güray Hatipoğlu1, 2Kira Sullivan-Wiley, 3Jaime Ashander
1Middle East Technical University, Earth System Science, Ph.D. Candidate, 2University of Notre Dame, Biological Sciences, Postdoctoral Associate, 3Resources for the Future; SESYNC Affiliate Scholar in Socio-Environmental Systems Modeling
In this series, we are asking: How might ideas from the social sciences improve ecological forecasting? What new opportunities and questions does the emerging interdisciplinary field of ecological forecasting raise for the social sciences? Using social science to understand how and when ecological forecasts are included in environmental policy can improve the ways in which ecological forecasters frame, communicate, and adapt their work.
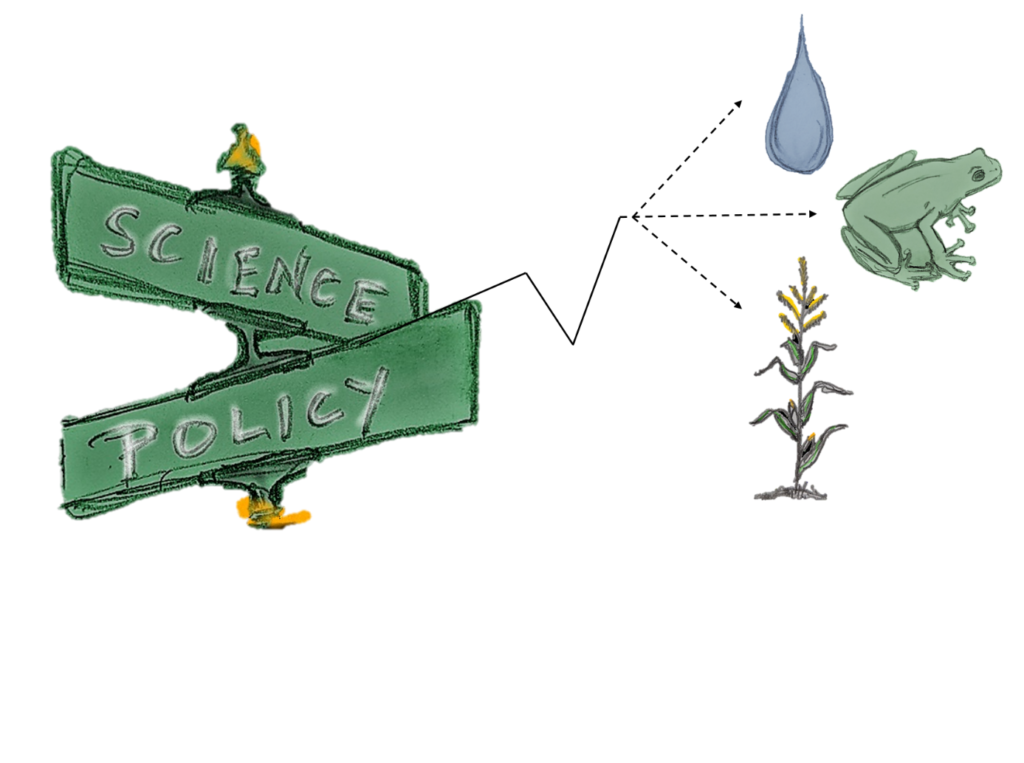
This installment engages with the relationship between ecological forecasts and environmental policy. The central aim of environmental regulations is to maintain critical services for local populations, including clean air, clean water, and biodiversity. The central aim of ecological forecasting is to predict future conditions under a particular set of circumstances, including policy and regulatory scenarios.
Because environmental regulation and ecological forecasting are both concerned with future environmental conditions, one might expect to find ecological forecasts included and/or integrated into environmental regulations. In this piece we ask, is this the case?
We identified several operational forecasts that are either currently used or mandated for future use by national or international regulations and treaties. These include a decision support system in the Baltic Sea, a harmful algal bloom monitoring system in the Republic of Korea, and a system for pest forecasting in Latvia. In this blog post, we trace each system from inception to operation to give insight into how ecological forecasts can be integrated into legislation and action.
An increasing problem in the Baltic Sea is widespread eutrophication. This issue, and the associated reduced fish stocks resulted in the creation of HELCOM, the Helsinki Commission, a multilateral decision making body for all states having a coast on the Baltic Sea. At first, HELCOM relied on close monitoring and measurements taken by individual states to address eutrophication. Over time, policies and binding rules were developed by HELCOM, but with incomplete scientific understanding of the complicated ecosystem dynamics of the Baltic Sea. Ultimately, HELCOM realized the utility and significance of an international independent scientific organization, to maintain a database where each state would report its pollutant loads and other relevant information. Moreover, HELCOM instituted a requirement of modeling ecosystem dynamics to generate both environmentally sound and economically feasible plans. In 1999, it initiated MARE (Marine Research on Eutrophication) to construct a user-friendly decision support system, NEST, for the Baltic Sea that is based on, inter alia, ecological models. NEST’s outputs were considered to be the “best available scientific information” in the 2007 HELCOM Baltic Sea Action Plan. The Plan explicitly incorporates NEST outputs into decisions made to control eutrophication. The NEST is still operational and can be used by anyone freely (scroll to the bottom of this webpage to find details about the different versions of NEST and how to download the tool).
In addition to the direct use of forecasts by government decision makers, there are also instances of the government supporting ecological forecasts intended for the public, akin to daily weather forecasts. The National Institute of Fisheries Science of the Ministry of Oceans and Fisheries of the Republic of Korea actively monitors harmful algal blooms in its country’s coastal areas and issues forecast alarms regarding its spread. This system, Red Tide Control Room, developed after dramatic fish losses owing to the harmful algal blooms, with their forecasts widely broadcasted to everyone that might be affected.
Another example is Latvia’s Plant Protection Center’s (PPC) and its use of RIMPro forecasts to aid in responsible use of pesticides. RIMPro is a forecasting tool initially developed to forecast apple pests (though it has diversified since) and is intended to inform growers’ decisions on the use of pesticides on apple trees. This particular product was chosen by PPC after substantial research, a growing body of knowledge including from the local people, and comparisons with several other available forecasting tools. The Plant Protection Center has been working for more than a hundred years and has historically collaborated directly with governmental bodies on preparing legislation. The institute’s recently separated research arm (Agrihorst) conducts state-sanctioned monitoring and research on pest management and broadcasts RIMPro forecasts, normally a commercial product, on their websites freely for regions of Latvia.
In these examples, ecological forecasts of complicated ecological phenomena — MARE NEST for eutrophication in the Baltic Sea, the Republic of Korea’s Red Tide Control Room for harmful algal blooms, RIMPro for pests in Latvia — are incorporated directly and formally into environmental decisions. These examples indicate that the widespread use of ecological forecasts may depend not only on their predictive power but also on how they are integrated and recognized in formal decision processes. Experience and social science research suggest alignment of stakeholder goals and co-production with stakeholders are two necessary components to achieve this tight integration. Use of this and other knowledge from decision sciences or organizational sciences can help to develop forecasts that are fit for purpose.
Social Science in Ecological Forecasting: People refining forecast visualization
Date: March 23, 2020
Post by: Kathy Gerst1, Kira Sullivan-Wiley2, and Jaime Ashander3
Series contributors: Mike Gerst4, Kailin Kroetz5, Yusuke Kuwayama6, and Melissa Kenney7
1 USA National Phenology, 2Boston University, 3Resources for the Future, 4University of Maryland, 5University of Arizona, 6Arizona State University, 7University of Minnesota
In this series, we are asking: How might ideas from the social sciences improve ecological forecasting? What new opportunities and questions does the emerging interdisciplinary field of ecological forecasting raise for the social sciences? This installment engages with the relationship between the people producing forecast outputs and the people interpreting those outputs.
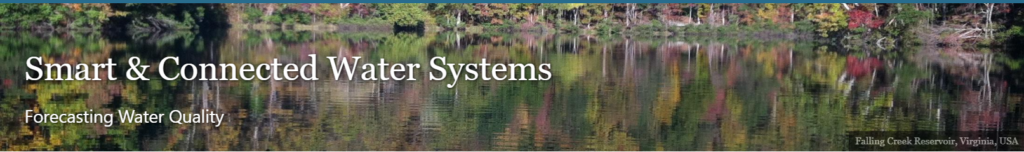
First, it is important to note that some forecast products have a specific and known user (e.g., the EFI-affiliated Smart Reservoir project producing forecasts for the Western Virginia Water Authority). Others are produced for public use (e.g., weather forecasts) or by a wide range of potential users, some of whom may be known, but others not. This is important because there is variability in how people perceive, engage with, and understand visual products. This variability was seen in popular media in 2015 when the picture of a dress went viral and people could not agree on whether the dress was gold and white or black and blue. What people “see” can vary based on differences in not only neurology, but also personal experiences and perspectives. For forecasters, this means that we should never assume that a visual product that means one thing to us will automatically have the same meaning for the people using it.
Using social science approaches to gain insights on how stakeholders perceive and use forecast outputs can improve the ways in which model outputs are visualized and shared.
One example where people contribute to the design and refinement of forecasts comes from the USA National Phenology Network (USA-NPN; www.usanpn.org). The USA-NPN collects, stores, and shares phenology data and information to advance science and inform decisions. To do so, USA-NPN engages stakeholders, including natural resource managers and decision-makers, to guide the prioritization, selection, and development of data products and tools. This happens through a deliberate effort to engage and seek input from existing and new stakeholder audiences by cultivating relationships that can lead to collaborative teams and co-production of products. In this way, data users are actively involved throughout the process of scoping and developing projects that meet their needs.
An example of a USA-NPN product designed with stakeholder input is the suite of Pheno Forecast maps (www.usanpn.org/data/forecasts); these maps show, up to 6 days in advance, when insect pests and invasive species are going to be in life stages that are susceptible to treatment. Interactions with end users after pilot maps were released revealed several opportunities for improvement.
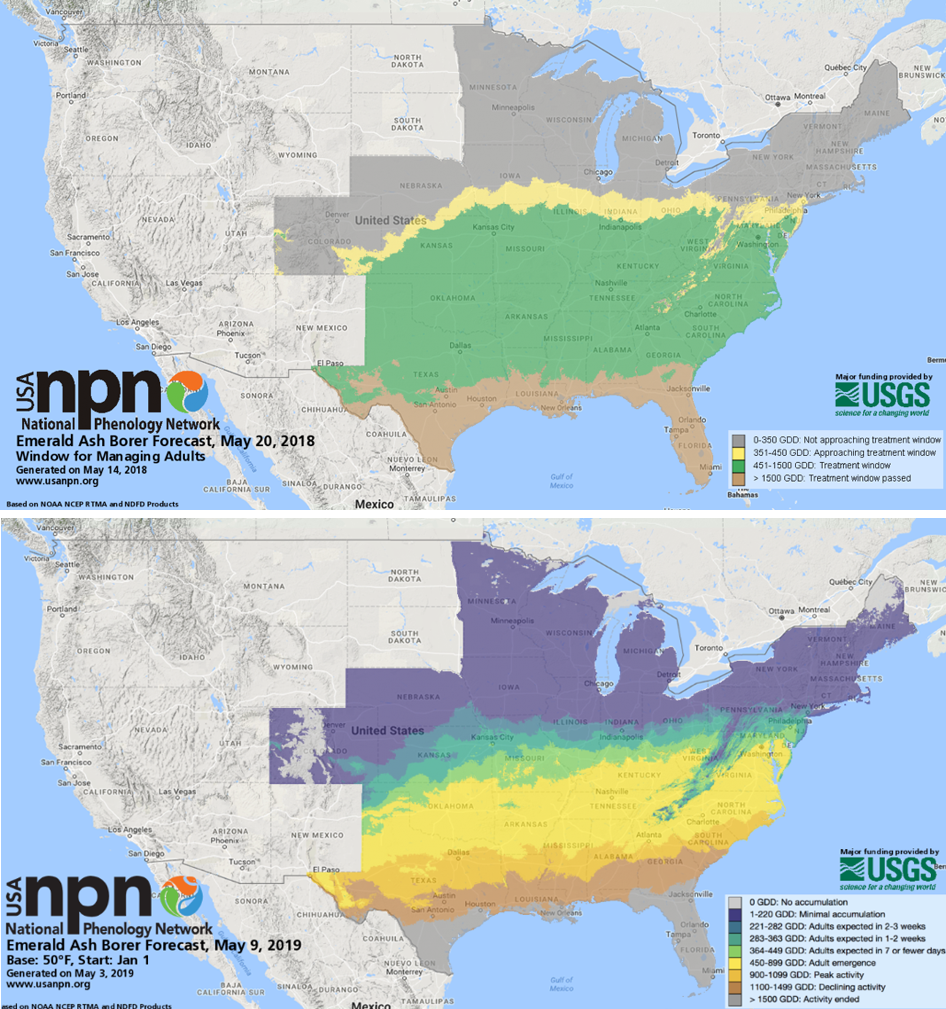
The original maps released in 2018 were focused on the “timing of treatment” –
that is, map categories portrayed locations based on whether they were
occurring before, during, or after particular treatment windows. Stakeholders
requested the visualized information
reflect life stages (e.g. eggs hatching or adults emerging) rather than
treatment window status (e.g. “approaching treatment window”), giving the end
user the opportunity to determine when (or if) to implement treatment (Figure 1). This visualization style also increased the
potential for the forecasts to be used by a broader community of people,
especially those with interests other than treatment.
In addition, some end users indicated that the original legend categories reflecting treatment window were too broad, and advocated for the use of narrower legend categories that allowed for more spatial differentiation among categories and more precise lead time before life stage transitions. Through consultation and the inclusion of stakeholders in the process, the NPN was able to harness the collective knowledge of the community to ultimately provide users with more nuanced and actionable information.
This case highlights both the importance of visualizations in communicating forecast information and the importance of recognizing that visualizations are more successful when they reflect a range of potential users and uses. Approaches such as stakeholder participation and forecast co-production are likely to increase the usability of forecast products and their associated decision tools.
Further reading
Additional resources will be updated in a living document that EFI is working to put together. We will add a link here once that goes live.
Academic Books and Articles
Books by Denis Wood and co-authors on the ideologies, power dynamics, and histories embedded in maps. These accessible books may be particularly interesting for those interested in how visualizations (maps) can be harnessed by different people to establish or reclaim power, shape the human-environment relationship, or project a particular vision of reality.
- Weaponizing Maps (2015): This book explores the “tension between military applications of participatory mapping and its use for political mobilization and advocacy”
- Rethinking the Power of Maps (2010): This book updates the 1992 “Power of Maps” and expands it by exploring “the promises and limitations of diverse counter-mapping practices today.”
- The Natures of Maps (2008): This book draws examples from maps of nature (or environmental phenomena) in order to reveal “the way that each piece of information [visualized in the map] collaborates in a disguised effort to mount an argument about reality” in ways that can shape our relationship to the natural world.
- The Power of Maps (1992): This book shows “how maps are not impartial reference objects, but rather instruments of communication, persuasion, and power…[that] embody and project the interests of their creators.”
Masuda (2009). Cultural Effects on Visual Perception. In book: Sage encyclopedia of perception, Vol. 1, Publisher: Sage Publications, Editors: In E. B. Goldstein (Ed, pp.339-343). link
This chapter is a good overview of psychology research on how culture can influence what and how we “see.” It is full of research examples and is written in an accessible way.
Burkhard, “Learning from architects: the difference between knowledge visualization and information visualization,” Proceedings. Eighth International Conference on Information Visualisation, 2004. IV 2004., London, UK, 2004, pp. 519-524. IEEE link
This paper is a quick and helpful overview of how a complement of tools can help us communicate either information or knowledge, drawing on tools used by architects (i.e. sketches, models, images/visions)
Chen et al. (2009) “Data, Information, and Knowledge in Visualization” IEEE. link
This paper is a good reference for the distinctions among data, information, and knowledge, and how these can and should be treated differently in visualization products. Especially useful for those interested in distinctions in how these topics are treated in the cognitive and perceptual space as opposed to the computational space.
Blog posts on “best practices in data/information visualization” from data science companies
Note: These practices underlie many of the visualizations produced and shared from the private sector and appear in advertising and media outlets—visualizations and visualization styles that will be familiar to most users of ecological forecasts
- From Oracle Data Science
- From GoodData
- From Toptal
Social Sciences in Ecological Forecasting
Date: December 13, 2019
Post by: Kira Sullivan-Wiley1 and Jaime Ashander2
Series contributors: Mike Gerst3, Kathy Gerst4,5, Kailin Kroetz6, Yusuke Kuwayama2, and Melissa Kenney7
1Boston University, 2Resources for the Future, 3University of Maryland, 4USA National Phenology Network, 5University of Arizona, 6Arizona State University, 7University of Minnesota
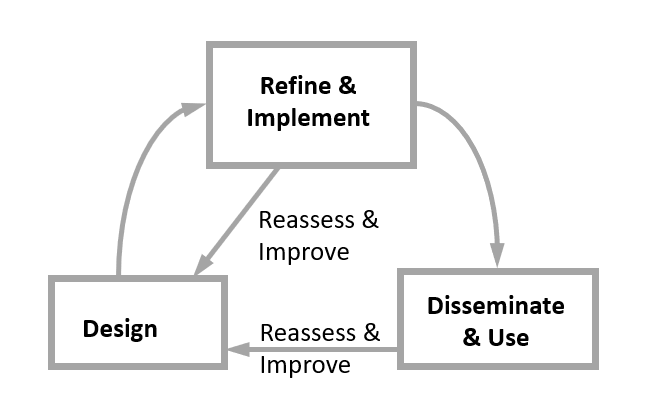
Ecological forecasting involves models and ecology but is also a fundamentally people-centered endeavor. In their 2018 paper, Mike Dietze and colleagues outlined the ecological forecasting cycle (Figure 1 is a simplified version of that cycle) where forecasts are designed, implemented, disseminated, iteratively reassessed and improved through design. This cycle is about a process, and in each part of this process there are people. Wherever there are people, there are social scientists asking questions about them, their actions, and how to improve decisions made by these insights.
So we ask the questions: How might ideas from the social sciences improve ecological forecasting? What new opportunities and questions does the emerging interdisciplinary field of ecological forecasting raise for the social sciences?
This post introduces a series of posts that address these questions, discussing opportunities for the social sciences in Ecological Forecasting Initiative (EFI) and gains from considering humans in forecasting research. Thus, our aim is to better describe the role of social scientists in the ecological forecasting cycle and the opportunities for them to contribute to EFI.
So where are the people?
At EFI, we’re interested in reducing uncertainty of forecasts, but also improving the processes by which we make forecasts that are useful, useable, and used. This means improving forecasts, their design, use, and impact, but it also results in a range of opportunities to advance basic social science.
To do this we need to know: Where are the people in this process? Where among the boxes and arrows of Figure 1 are people involved, where do their beliefs, perceptions, decisions, and behavior make a difference? Are there people outside this figure who matter to the processes within it? Figure 2 highlights critical groups of people involved, and some of the actions they take, that are integral to the ecological forecasting process.
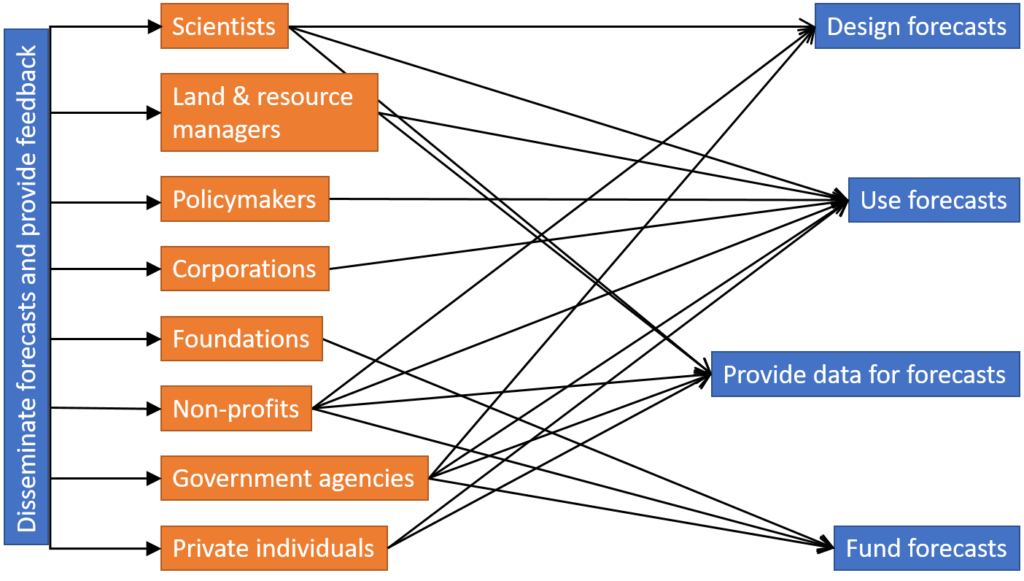
Figure 2 moves beyond the three-phase process described in Figure 1 because the process of ecological forecasting is predicated on funding sources and data, often provided by people and processes outside the forecasting process. So when we think about where social science belongs in ecological forecasting, we have to look beyond the forecasting process alone.
Making forecasts better
If EFI wants to make this process work and produce better forecasts, which of these actors matters and how? How might different stakeholders even define a “better” forecast? One might think of “better” as synonymous with a lower degree of uncertainty, while another might measure quality by a forecast’s impact on societal welfare. Ease of use, ease of access, and spatial or temporal coverage are other metrics by which to measure quality, and the relative importance of each is likely to vary among stakeholders. Social science can help us to answer questions like: Which attributes of a forecast matter most to which stakeholders, under what conditions, and why?
While a natural scientist might assess the quality of a forecast based on its level of uncertainty, a social scientist might assess the value of a forecast by asking:
- What individuals are likely to use the forecast?
- How might the actions of these individuals change based on the forecast?
- How will this change in actions affect the well-being of these or other individuals?
Building “better forecasts” will require a better understanding of the variety of ways that stakeholders engage with forecasts. The posts in this blog series will shine a spotlight on some of these stakeholder groups and the social sciences that can provide insights for making forecasts better. Posts in the series will discuss issues ranging from how stakeholders interact with forecast visualizations to the use of expert judgements in models to when forecasts should jointly model human behavior and ecological conditions. Considering these questions will help forecasters design forecasts that are more likely to increase our understanding of these socio-environmental systems and enhance societal well-being.
These examples hint at the range of potential interactions between the social sciences and ecological forecasting. There is a wealth of opportunity for social scientists to use the nascent field of ecological forecasting to ask new and interesting questions in their fields. In turn, theories developed in the social sciences have much to contribute to emerging interdisciplinary practice of ecological forecasting in socio-environmental systems. As we can see, better ecological forecasting may require us to think beyond ecological systems.