
September 5, 2023
Brendan Allison1, Olufemi Fatunsin2, Jeffrey Mintz3
1University of Texas, Austin, 2University of Alabama, 3University of Florida
AS NSF NEON data becomes more prominent in forecasting and other forms of ecological modeling, these models may potentially become products in themselves, distilling some important characteristic of this continental-scale network. A natural follow-up question as we seek to use not only the raw data but these derived products is that of model transportability. In this project group started at the 2023 Unconference, we asked:
1) How can we take models trained on NEON data and refine them for use in another context?
2) How can we take models trained on non-NEON data and refine them on NEON data?
Doing this effectively can empower a range of applications, including local field studies, adaptive management, and data fusion from multiple monitoring networks, enabling greater statistical power for big ecological questions. We realized that, whether transporting a model to or from NEON, the vast majority of challenges are the same. These included unbalanced data, different monitoring protocols, different predictors, and different site selection criteria. As anyone who has fused multiple datasets together can tell you, even ostensibly identical data products can differ in both subtle and dramatic ways. Naturally, models trained on one data product will inherit the distinct characteristics of the monitoring networks they are derived from. There is nevertheless remarkable potential in being able to leverage what are in many cases continental-scale models for anything from fusion with another continental-scale network to an informed prior for a small-scale field study, dramatically increasing statistical power.
In framing the problem, we found it helpful to consider similarities with longstanding efforts to effectively downscale global climate models to local forecasts. Here, the two main classes of approach are dynamic (re-running a tuned version of the full model with nested local components, ensuring that known physics are respected) and statistical (examining correlations between global climate model outputs and local history, with the benefit of much faster performance). For the greatest flexibility, including compatibility with black-box machine learning approaches with unknown dynamics, we took inspiration from the statistical approaches.
Our only hard requirement as input for the modeling process was thus an existing model that can make predictions for an arbitrary set of sites, given a set of predictor covariates for these sites, alongside the ability to measure the true value of the predicted variable at these sites. From here, we can subtract prediction from true value, generating a dataset of residual errors. This sort of additive bias correction is not the only approach to the problem, but it is simple and effective. Any skill in predicting these errors represents an improved model: simply take the sum of the original model and the bias correction term to make new forecasts. At the same time, one may examine the various machinery of the residual error model alone to learn something about the gaps and biases in the original model. Allowing models to be incrementally improved in this fashion will enable teams to improve on existing models by tailoring them to their particular ecosystem of interest and the data they have at hand.
Case Study
To focus our efforts, we picked the particular case study of bringing together NEON forest data with similar datasets generated under the Forest Inventory Analysis (FIA) program. Because FIA has multiple hundreds of thousands of plots measured across decades of operation, while the more recent NEON network offers more intensive monitoring within a smaller set of sites, both networks have the potential to bolster one another. Our basic setup was to train a model predicting forest productivity at FIA sites from a small set of environmental covariates. Though we would train this ourselves, we would not take advantage of our knowledge of its structure or details. Instead, it serves as a stand-in for any existing black box model, which in some sense represents the distillation of a large body of FIA data. Typically, it would be a model generated by some other research group or forecasting team, which we seek to leverage in our own work. Using predictions from this FIA-trained model, we calculate a set of error residuals at both NEON and FIA sites, and ask: can we leverage this for a more robust multi-system model?
Our first product was the development of a draft Bayesian multilevel model that would be equally capable of integrating multiple sets of continental or global-scale monitoring networks as it would be of making predictions at a single site of interest, but informed by some larger statistical structure. We show our first/guiding version of this in the figure below; it changed a little over development, but the basic idea remained. Hierarchical structures such as this are commonly described as partial pooling approaches. This is because FIA and NEON systems are not assumed to operate under the same model. Nor are they assumed to be fully independent. Instead, they will flexibly share a set of data-driven parameters, in this case through the top layer of a global forestry model, while having the flexibility to stray a little from this global model to account for system-specific differences.
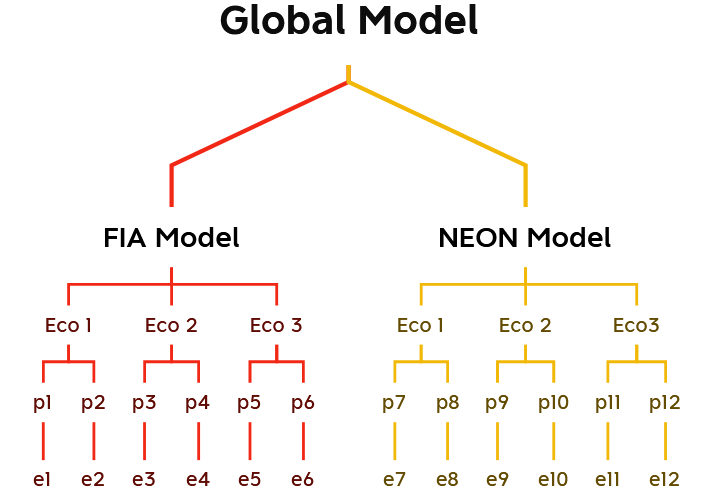
To account for spatial autocorrelation, we briefly considered Gaussian processes, but settled on building ecoregions into the model hierarchy for two main reasons. The first is that geographic distance is different from ecological distance: a mile might take you from prairie to mountaintop in one case, and from prairie to prairie in another case. The second is practical: because Gaussian processes and related kernel methods tend to scale poorly with increasing data, they tend to require extensive approximations for the fusion of multiple continental-scale datasets.
As mentioned, while this was our inspiration, we did make a few changes. The main change was to dial back on the nesting. In the above diagram, ecoregions are nested inside continental-scale monitoring networks, such that Level 3 – Ecoregion 1 – NEON plots are allowed to have different predictive models than Level 3 – Ecoregion 1 – FIA plots. This could be useful and true, but we realized that we were most interested in 1) the global forestry model at the top of the hierarchy, 2) any global differences between the types of sites or measurement protocols of NEON and FIA, and 3) any Level 3 Ecoregion variations in model structure. Thus the minor combinatorial explosion in parameters of nesting ecoregions inside monitoring systems seemed a cost without a corresponding benefit in scientific lessons learned. We decided to bring both ecoregion and monitoring system variables to the same level of the hierarchy.
So far, the model has been tested on synthetic data, with code developed in Stan, using the CmdStanR library in R. Once we’ve had the chance to hone the model against real data, we’ll push all the code to a NEON repository for the community to begin playing around with it. From there, some version of the project is likely to continue and become a more formal manuscript. We may also reintroduce some complexity to the model in the form of nested ecoregions.
With that said, we’d be interested in hearing from other members of the community. How to integrate NEON data with that of other monitoring networks, how to use it to inform local field studies, and how to leverage it for management goals at non-NEON sites are all open and important questions. What potential applications do you see? Are you working on similar projects?
Contact us at info@ecoforecast.org to share your interests in the project or similar work you are doing!