Algal blooms cost the U.S. economy $2.2-4.6 billion dollars per year on average in water treatment and economic losses (Hudnell, 2010). Developing the capacity to predict when and where these blooms might occur could greatly reduce their impact. While much attention has been given to advancing predictive capabilities for algal blooms in lakes, river algal blooms can also cause substantial socio-ecological impacts, yet our understanding of their dynamics lags that of lakes. Fortunately, the number and diversity of observations that can be used to predict algal blooms are rapidly increasing (e.g., chlorophyll sensors), which enables powerful modeling techniques to extract patterns from these data and predict future HABs with sufficient lead time to initiate appropriate management interventions. Chlorophyll serves as a reliable proxy for algal biomass and can indicate when there might be an impending algal bloom. With this challenge, we hope to compare many different approaches for forecasting river chlorophyll to better understand the predictability of chlorophyll and potentially HABs in rivers across the United States.
How can I get involved?
Getting involved is easy! Simply visit our EFI-USGS River Chlorophyll Forecast Challenge website to register and gain access to all the necessary resources and instructions. Whether you’re a seasoned researcher, a budding data scientist, or participating in a classroom project, there’s a place for you in this challenge. We provide step-by-step instructions, target data, numerical weather forecasts, and tutorials to empower you throughout the process. Plus, all forecasts and scores are publicly available, fostering transparency and collaboration within the community.
Who is organizing?
The Ecological Forecasting Initiative (EFI) is a grassroots consortium dedicated to building and supporting an interdisciplinary community of practice around near-term ecological forecasts. EFI has been running a separate forecast challenge since 2021, welcoming participants to forecast ecological data at National Ecological Observatory Network sites (Thomas et al. 2023). Building forecast models, generating forecasts, and updating these forecasts with new information requires a lot of data, and fortunately the USGS is largest provider of in-situ water information in the world. The USGS Proxies Project teamed up with EFI to select monitoring sites that fulfill the data requirements for a forecast challenge while also being strategically chosen based on their scientific, management, or social significance. Our EFI-USGS team is committed to advancing research in ecological forecasting and environmental modeling and your participation enhances this effort!
Are there any prizes or awards?
While there are no monetary rewards, the benefits of contributing are substantial. Participants can expect to advance their forecasting skills, find joy in tackling complex ecological problems, and potentially be involved in the creation of manuscripts based on their contributions. Our forecasting challenge serves as a platform for the ecological and data science communities to enhance their skills in forecasting ecological systems. By generating forecasts, participants contribute to a synthetic understanding of patterns of environmental predictability.
What if I have questions and will there be updates?
Have questions or need assistance? Feel free to reach out to Jacob Zwart at jzwart@usgs.gov for prompt support and guidance. Additionally, stay updated on the latest developments and announcements by visiting the EFI-USGS River Chlorophyll Forecast Challenge website. We’re here to ensure your experience in the challenge is smooth and rewarding, so don’t hesitate to reach out with any questions.
1University of Texas, Austin, 2University of Alabama, 3University of Florida
AS NSF NEON data becomes more prominent in forecasting and other forms of ecological modeling, these models may potentially become products in themselves, distilling some important characteristic of this continental-scale network. A natural follow-up question as we seek to use not only the raw data but these derived products is that of model transportability. In this project group started at the 2023 Unconference, we asked:
1) How can we take models trained on NEON data and refine them for use in another context?
2) How can we take models trained on non-NEON data and refine them on NEON data?
Doing this effectively can empower a range of applications, including local field studies, adaptive management, and data fusion from multiple monitoring networks, enabling greater statistical power for big ecological questions. We realized that, whether transporting a model to or from NEON, the vast majority of challenges are the same. These included unbalanced data, different monitoring protocols, different predictors, and different site selection criteria. As anyone who has fused multiple datasets together can tell you, even ostensibly identical data products can differ in both subtle and dramatic ways. Naturally, models trained on one data product will inherit the distinct characteristics of the monitoring networks they are derived from. There is nevertheless remarkable potential in being able to leverage what are in many cases continental-scale models for anything from fusion with another continental-scale network to an informed prior for a small-scale field study, dramatically increasing statistical power.
In framing the problem, we found it helpful to consider similarities with longstanding efforts to effectively downscale global climate models to local forecasts. Here, the two main classes of approach are dynamic (re-running a tuned version of the full model with nested local components, ensuring that known physics are respected) and statistical (examining correlations between global climate model outputs and local history, with the benefit of much faster performance). For the greatest flexibility, including compatibility with black-box machine learning approaches with unknown dynamics, we took inspiration from the statistical approaches.
Our only hard requirement as input for the modeling process was thus an existing model that can make predictions for an arbitrary set of sites, given a set of predictor covariates for these sites, alongside the ability to measure the true value of the predicted variable at these sites. From here, we can subtract prediction from true value, generating a dataset of residual errors. This sort of additive bias correction is not the only approach to the problem, but it is simple and effective. Any skill in predicting these errors represents an improved model: simply take the sum of the original model and the bias correction term to make new forecasts. At the same time, one may examine the various machinery of the residual error model alone to learn something about the gaps and biases in the original model. Allowing models to be incrementally improved in this fashion will enable teams to improve on existing models by tailoring them to their particular ecosystem of interest and the data they have at hand.
Case Study
To focus our efforts, we picked the particular case study of bringing together NEON forest data with similar datasets generated under the Forest Inventory Analysis (FIA) program. Because FIA has multiple hundreds of thousands of plots measured across decades of operation, while the more recent NEON network offers more intensive monitoring within a smaller set of sites, both networks have the potential to bolster one another. Our basic setup was to train a model predicting forest productivity at FIA sites from a small set of environmental covariates. Though we would train this ourselves, we would not take advantage of our knowledge of its structure or details. Instead, it serves as a stand-in for any existing black box model, which in some sense represents the distillation of a large body of FIA data. Typically, it would be a model generated by some other research group or forecasting team, which we seek to leverage in our own work. Using predictions from this FIA-trained model, we calculate a set of error residuals at both NEON and FIA sites, and ask: can we leverage this for a more robust multi-system model?
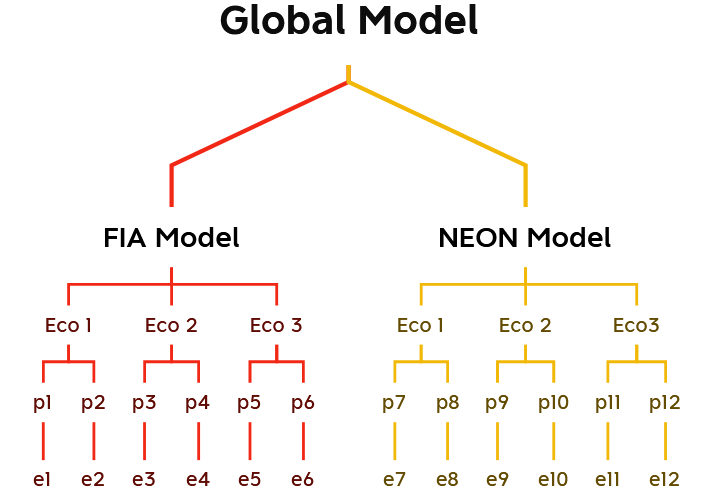
Our first product was the development of a draft Bayesian multilevel model that would be equally capable of integrating multiple sets of continental or global-scale monitoring networks as it would be of making predictions at a single site of interest, but informed by some larger statistical structure. We show our first/guiding version of this in the figure below; it changed a little over development, but the basic idea remained. Hierarchical structures such as this are commonly described as partial pooling approaches. This is because FIA and NEON systems are not assumed to operate under the same model. Nor are they assumed to be fully independent. Instead, they will flexibly share a set of data-driven parameters, in this case through the top layer of a global forestry model, while having the flexibility to stray a little from this global model to account for system-specific differences.
Figure 1 represents our original version of a partially pooled model. At the top layer, we have a global scientific model. This informs system-specific models in layer two, which then inherit ecoregion in layer three (eco_i) and plot-level parameters (p_j) in layer four. The bottom layer are the multiple observations at each plot. In this case, observations are not biomass or other direct data products, but residual error (e_k) after subtraction of predicted from actual values by some black-box model. The main modification to this model was to place the NEON and FIA models alongside the ecoregion layers as an additive source of variance, rather than nesting ecoregions inside the respective system models.
To account for spatial autocorrelation, we briefly considered Gaussian processes, but settled on building ecoregions into the model hierarchy for two main reasons. The first is that geographic distance is different from ecological distance: a mile might take you from prairie to mountaintop in one case, and from prairie to prairie in another case. The second is practical: because Gaussian processes and related kernel methods tend to scale poorly with increasing data, they tend to require extensive approximations for the fusion of multiple continental-scale datasets.
As mentioned, while this was our inspiration, we did make a few changes. The main change was to dial back on the nesting. In the above diagram, ecoregions are nested inside continental-scale monitoring networks, such that Level 3 – Ecoregion 1 – NEON plots are allowed to have different predictive models than Level 3 – Ecoregion 1 – FIA plots. This could be useful and true, but we realized that we were most interested in 1) the global forestry model at the top of the hierarchy, 2) any global differences between the types of sites or measurement protocols of NEON and FIA, and 3) any Level 3 Ecoregion variations in model structure. Thus the minor combinatorial explosion in parameters of nesting ecoregions inside monitoring systems seemed a cost without a corresponding benefit in scientific lessons learned. We decided to bring both ecoregion and monitoring system variables to the same level of the hierarchy.
So far, the model has been tested on synthetic data, with code developed in Stan, using the CmdStanR library in R. Once we’ve had the chance to hone the model against real data, we’ll push all the code to a NEON repository for the community to begin playing around with it. From there, some version of the project is likely to continue and become a more formal manuscript. We may also reintroduce some complexity to the model in the form of nested ecoregions.
With that said, we’d be interested in hearing from other members of the community. How to integrate NEON data with that of other monitoring networks, how to use it to inform local field studies, and how to leverage it for management goals at non-NEON sites are all open and important questions. What potential applications do you see? Are you working on similar projects?
Contact us at info@ecoforecast.org to share your interests in the project or similar work you are doing!
Melissa Kenney1, Michael Gerst2, Toni Viskari3, Austin Delaney4, Freya Olsson4, Carl Boettiger5, Quinn Thomas4
1University of Minnesota, 2University of Maryland, 3Finnish Meteorological Institute,4Virginia Tech, 5University of California, Berkeley
With the growth of the EFI NEON Ecological Forecasting Challenge, we have outgrown the current Challenge Dashboard, which was designed to accommodate a smaller set of forecasts and synthesis questions. Thus, we have reenvisioned the next stage of the EFI-RCN NEON Forecast Challenge Dashboard in order to facilitate the ability to answer a wider range of questions that forecast challenge users would be interested in exploring.
The main audience for this dashboard are NEON forecasters, EFI, Forecast Synthesizers, and students in classes or teams participating in the Forecast Challenge. Given this audience, we have identified 3 different dashboard elements that will be important to include:
forecast synthesis overview,
summary metrics about the Forecast challenge, and
self diagnostic platform.
During the June 2023 Unconference in Boulder, our team focused on scoping all three dashboard elements and prototyping the forecast synthesis overview. The objective of the synthesis overview visual platform is to support community learning and emergent theory development. Thus, the synthesis visualizations are aimed at creating a low bar entry for multi-model exploration to understand model performance, identify characteristics that lead to stronger performance than others, the spatial or ecosystems that are more predictable, and temporal forecast validity.
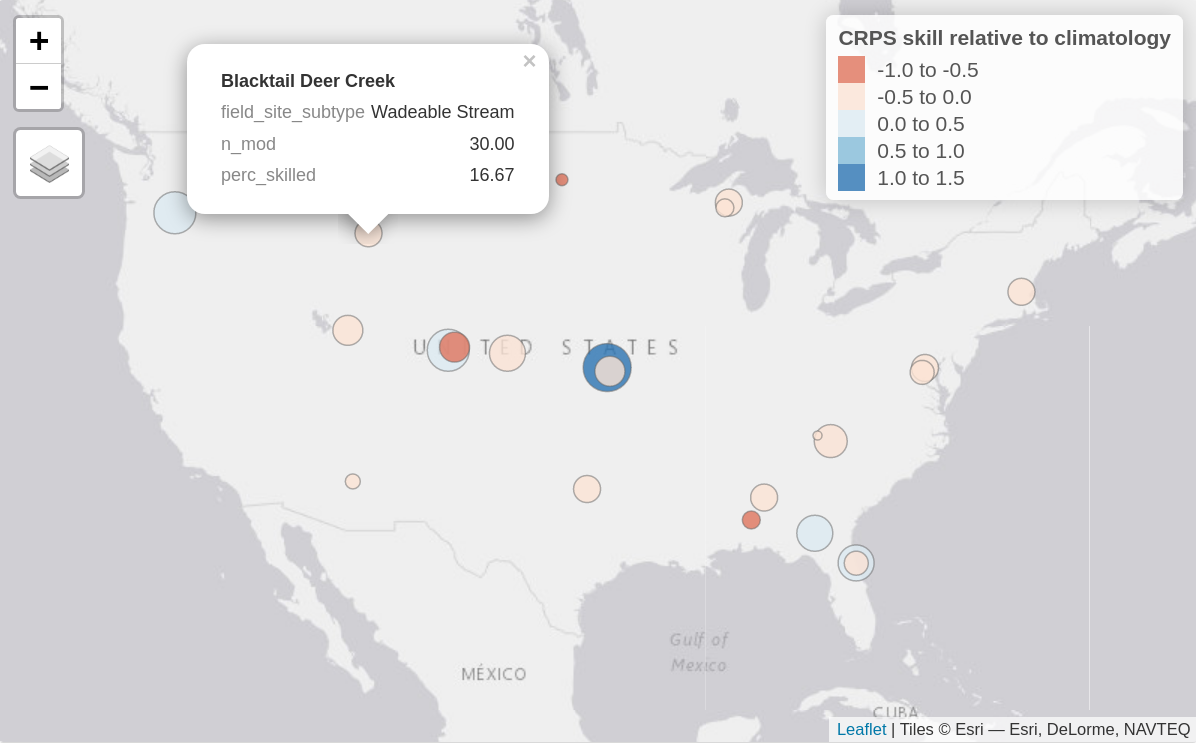
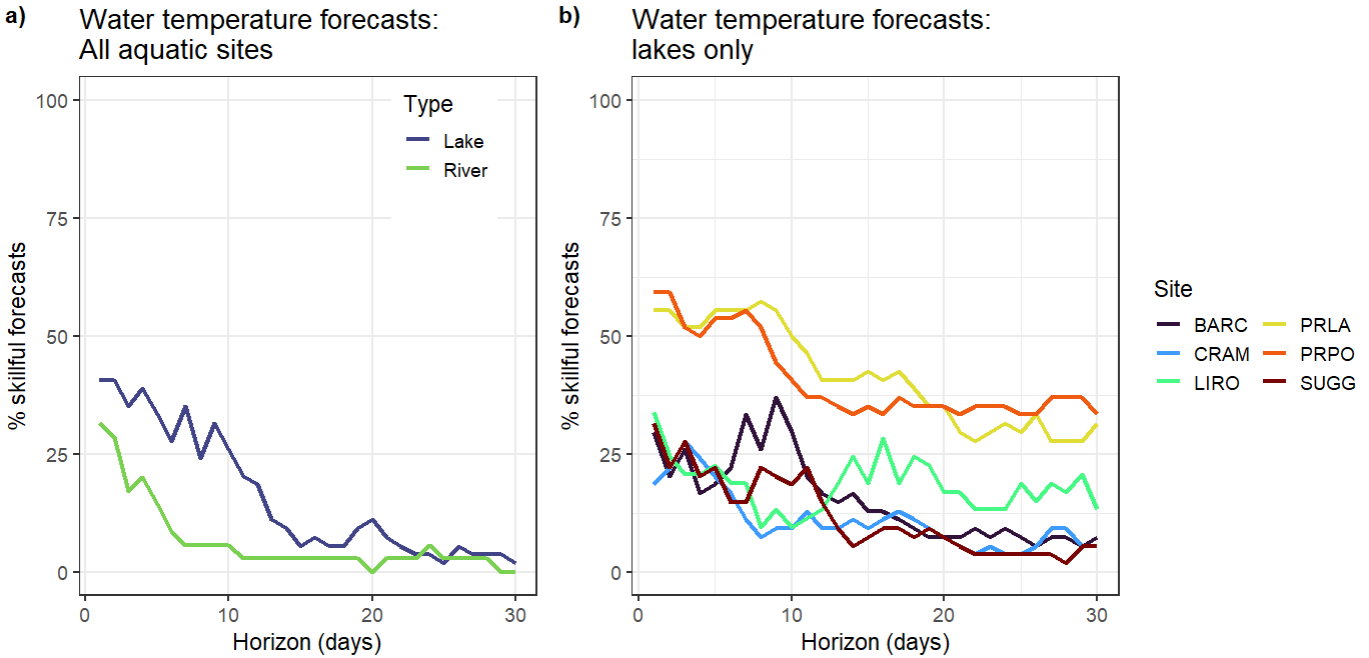
You can view the prototype developed during the meeting HERE and in Figures 1 and 2.
Figure 1. Static image of an interactive map of aggregate forecast skill relative to climatology at each forecasted sites, here showing the water temperature forecasts for the aquatics theme. Bubble colour represents the continuous rank probability score (CRPS) skill relative to climatology with positive values (blues) showing submitted models on average perform better than climatology and negative values showing submitted models perform worse (reds). The size of the bubble represents the percentage of submitted models that outperformed the climatology null (i.e., larger sized bubbles have a higher percentage of skilled models). When hovered over, the bubbles show this percentage (perc_skilled), the site type (field_site_subtype), as well as the total number of models forecasting at that site (n_mod).
Figure 2. a) Percentage of submitted models that are classed as ‘skillful’ (outperform the null climatology forecast based on the continuous rank probability score metric) at the river (n=27) and lake sites (n=6) for water temperature forecasts at each horizon from 1 to 30 days ahead. b) Percentage of submitted models that are classed as ‘skillful’ for water temperature forecasts at six of the lake sites (https://www.neonscience.org/field-sites/explore-field-sites).
Developing these graphics requires aggregation of skill scores.There are a multitude of metrics that can be used to calculate the skill score, which each have their own benefits and flaws. Thus, there should be multiple skill scores for different metrics with clear presentation of what metric is used at a given visualization. Additionally, in order to isolate what sites are more interesting from a model development perspective, there needs to be a comparison of how many of the models meet a baseline skill score at a given site at a chosen time frame. That allows isolating challenge areas and also easily informs which models really succeed at situations where others struggle. For better future analysis of how models perform at certain sites, we also envisage the visualization to include the skill scores for the relevant drivers (NOAA weather) for comparison. For example, if we see a drop in skill across models in water temperature projections after some time, there should be a direct method to assess if this reflects overall flawed model dynamics or if the weather forecast driving the water temperature loses its reliability. This also allows the user to approximate a maximum length in which the model performance analysis is at all useful.
In addition to the main synthesis overview, the goal of this platform is to support exploration of synthesis data. For all themes, there was general agreement that it would be useful to pull up at a glance, site characteristics, a photo, and basic summary statistics about the number of models and model performance.
During the meeting, we worked with the Aquatics and Beetles Challenge teams to identify some of the key data aggregation groupings that will be important to facilitate exploration. One important distinction arose during the conversations – the baseline model, time scale, and data latency. For Aquatics there is a long time series of data that create a climatology and data are provided relatively quickly via data loggers. For Beetles, there is a different null baseline model given the length of historic data that is different at each site and it takes a year to provide beetle abundance and richness assessment. There was also a desire to have specific types of synthesis visualizations including the species accumulation curve over years, 3-year running average, and indicating the lower and upper bounds of a particular variable (use in scale). Thus, for both Beetles and Aquatics there are similarities and differences in the types of groupings that would be most useful to support synthesis exploration.
Table 1. Different data groupings that would be useful to facilitate easy-to-develop synthesis visualizations of the EFI-NEON Forecast Challenge models to facilitate learning and community theory development.
Groupings
All Themes
Aquatics
Beetles
Team / Challenge
theme, site, model ID, customized classroom or team groupings
particular variables (e.g., DO) within a theme
Spatial / Ecosystems
sites, NEON domains, site type (river, stream, lake…), altitude (high vs lowlands)
sites by distance, dominant NLCD classification
Temporal Scale
average for past year, seasonal groupings,
1 day, 5 days, 7 days, 15 days, 30 days
14 days, growing season, multi-year (up to 5 year) forecasts
Models
best model at each site, model inputs, model structure, functional type, output uncertainty representation
model run time, model computational requirements
Skill Scoring
current skill forecast approaches, better than climatology/null baseline,
comparison of your model to the best forecast
Other Features
environmental variables and weather forecast observations
comparison with weather/climate forecast skill
disturbance events (e.g., widlfire), growing season dates at each sites, site disturbance characteristics (e.g., mowing, fencing)
In addition to the synthesis overview, there were two complementary and linked platforms that will create the dashboard. First, the objective of the forecast challenge overview is to provide a basic summary of metrics related to the overall EFI NEON Ecological Forecasting Challenge. Specifically, the metrics that would be included are: number of forecasts submitted, number of unique teams, percentage (or median of all) of models that are better than climatology or a null model per theme, and total forecast and observation pairs.
Second, the objective of the self-diagnositic platform is to provide an overview for individuals or team forecast contributions and performance. The types of summaries that will be provided for the forecasters are: confirmation of forecast submission, date of the most recent forecast submitted for a model, model performance relative to climatology or null model, model prediction versus observation, model performance vs other selected models, and model skill over a specific time horizon (to assess whether it performs better over time).
Overall, the goal of the re-envisioned visual dashboard is to create platforms that will allow us to track challenge engagement, individually or as a team diagnose any model submission problems and performance improvement opportunities, and support community theory development through a synthesis given the range of models submitted through the EFI NEON Ecological Forecasting Challenge. Long-term, if this platform structure is useful and robust, it could be applied to other systems where there are multi-model predictions and there is a desire to collaboratively learn together to improve our theoretical understanding and forecasts to support decision-making.
We are looking for input from the EFI community on the synthesis dashboard for other themes, to discuss with individuals what synthesis would be most relevant to phenology, terrestrial, and ticks forecasters. Reach out to info@ecoforecast.org to share your thoughts or let us know you would like to join future conversations about updating the dashboard.
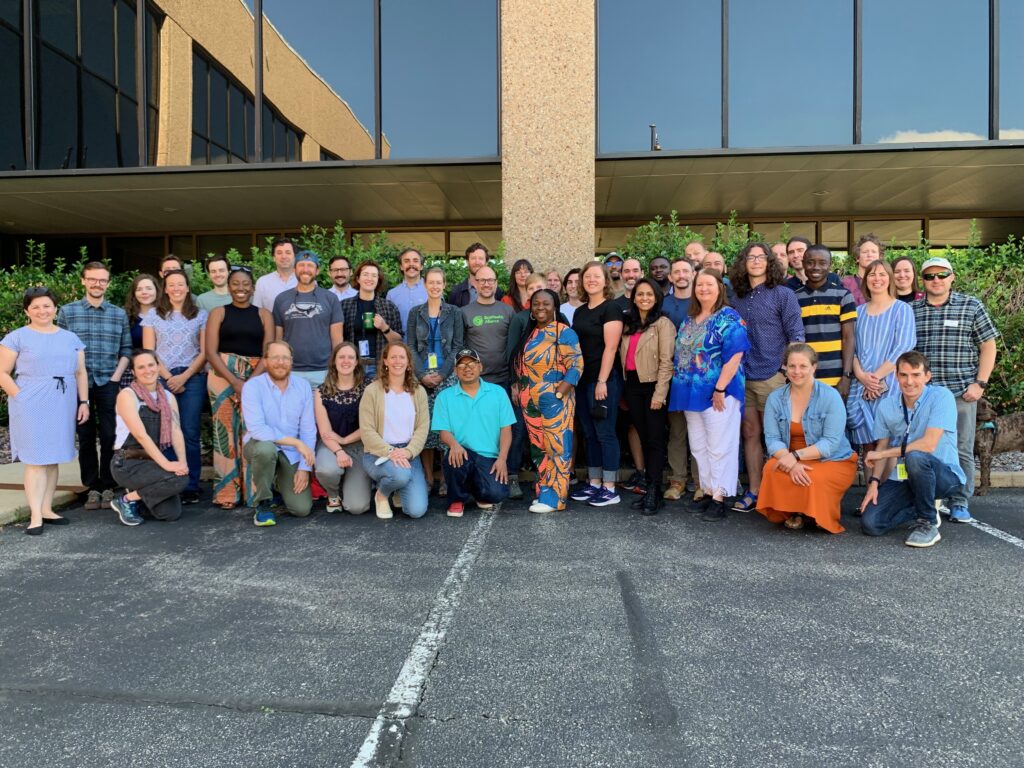
The 2023 EFI Unconference, hosted by the Ecological Forecasting Initiative Research Coordination Network (EFI RCN) and supported by the National Science Foundation, brought together 45 passionate individuals at the National Ecological Observatory Network (NEON) headquarters in Boulder, Colorado on June 21-23, 2023 to work on a diverse range of projects that were nominated and selected by the participants. With a focus on collaborative problem-solving, the Unconference fostered a unique environment for participants to exchange knowledge, generate new approaches, and advance the field of ecological forecasting.
In addition to project development, activities included a warm welcome from Kate Thibault, NEON Science Lead, icebreaker activities, expertly facilitated by Cayelan Carey from Virginia Tech that helped participants connect and form meaningful relationships, a tour of NEON facilities, and a poster session and social hour, where participants showcased their research and projects. Through these activities, Unconference participants and NEON staff were able to engage with one another, exchange feedback, and forge new collaborations.
To ensure a productive and focused Unconference, participants engaged in a review of project ideas and subsequent project selection. This process allowed attendees to propose projects aligned with their interests and expertise and fostered a sense of ownership and investment in the outcomes. Ten project groups developed out of the 24 that were initially proposed as part of the pre-meeting preparation.
Summaries provided by each project working group are listed below. Some groups will provide additional details in forthcoming blog posts, so be sure to watch for those future posts.
This was the first in-person EFI event since 2019 and it was absolutely lovely to be in the same room to meet new people and to see in-person people we had only seen on Zoom before. We appreciate the Unconference participants’ willingness to share their time, talents, and perspectives. As you will read below, there were a number of accomplishments over the three days of the meeting and we look forward to seeing future outcomes from what was developed at the Unconference!
Unconference participants. Photo courtesy Quinn Thomas
Participants: John Smith, David Durden, Emma Mendelsohn, Carl Boettiger
To date, the NEON Ecological Forecasting Challenge has been focused on generating near term forecasts for specific sites. However, many interesting ecological phenomena occur across both time and space. At the EFI 2023 Unconference, our group prototyped a forecasting challenge that is also spatially explicit. For our prototype forecasting challenge, we focused on Leaf Area Index (LAI) recovery in post-burn areas. Our focal sites so far include the California August complex fire and the Colorado East Troublesome fire. Our work at the Unconference focused on building cyber-infrastructure to ingest and aggregate data, build target files, assess models using proper scoring rules, and build baseline climatological forecasts. Current progress, including an example notebook and a detailed workflow diagram, are available on GitHub: https://github.com/eco4cast/modis-lai-forecast/. Current and future work includes building additional baseline models, setting up a submission portal using GitHub actions, and integrating additional sites to include a variety of ecoclimatic domains.
Participants: Noam Ross, Eli Horner, Ashley Bonner, Mike Dietze, Chris Jones
Interest and use of ecological forecasting have increased in recent years due in large part to the efforts of EFI, including the NEON Ecological Forecasting Challenge. However, only a small percentage of ecological forecasts published have fully quantified and partitioned their forecast uncertainties. Quantifying and validating model predictions and uncertainties allows for understanding the degree of uncertainty in forecasts and how much we understand the underlying ecological system (our ability to predict them). Partitioning forecast uncertainties allows for increased focus on data collection efforts that could lead to improved model performance and reduction in uncertainty. Our group worked toward creating a tutorial for how to quantify and partition forecast uncertainties and validate model predictions with uncertainty by using the NEON Phenology Forecasting Challenge. We are using an ARIMA model and a random forest model as examples. During the Unconference we were able to get both models working and partition uncertainties. We are finishing up the code base, tutorial, and discussing challenges with each type of model when it comes to performing uncertainty quantification and partition.
Forecasting Impacts: Measuring the Current and Future Impacts of EFI
Participants: Rebecca Finger-Higgens, Jessica Burnett, Alexis O’Callahan, Ayanna St. Rose
It turns out getting-to-know-you style ice breakers can provide more than just a few new friends, they can also demonstrate group priorities and motivations for coming together in the first place. On a sunny morning at the NEON Headquarters in Boulder, CO, Cayelan Carey (Virginia Tech) asked the group of EFI Unconference participants to organize themselves based on whether they individually felt that the goal of forecasts were for understanding or decision making. As the participants shuffled around and considered the question before them, the final results revealed a pattern among the group that resembled a skewed desire for forecasts to inform decision making versus broadening the understanding of ecological systems. However, the ability of ecological forecasts to effectively inform decision making has not clearly been measured. Besides directly impacting decision making processes, how do we, as a grassroots organization, recognize and measure the other societal impacts that EFI might be, or capable, of creating?
This led our group to think through ways that EFI could measure impacts, to ask: what are the impact goals and achievements of EFI, what does the community want out of EFI, and what is the best way to measure these often hard to measure metrics? Using five categories of societal impacts (instrumental applications, connectivity impacts, conceptual impacts, capacity building, and socio-ecological impacts), we developed a poll for Unconference participants to assess the priorities and current thoughts of this representative group. The poll results suggest that EFI community goals emphasize conceptual impacts (i.e. improve ecological understanding), connectivity impacts (i.e. maintaining and developing community and partnerships) and instrumental applications (i.e., applications for decision making). We also found that EFI has made the greatest advancements in capacity building (i.e., curriculum development, short courses), conceptual impacts (i.e., working groups), and connectivity impacts (i.e., newsletters and conference sessions). These discoveries have allowed us to identify a space for the creation of a concrete link between the connectivity of forecasting and the desired application outcomes of the group. It has allowed us to develop a number of recommendations for the steering committee and the EFI community. Some of these recommendations include focusing on if, how, and why a created forecast product achieves one of the five predefined societal benefits. Together, we hope to continue to build on the vision statement of EFI to build forecasts to understand, manage, and conserve ecosystems in a measurable and remarkable way.
Figure 1: Word cloud generated from Unconference participant responses to the question “describe the potential, importance, or value of the community of EFI”.
Reenvisioning the NEON Ecological Forecasting Challenge Dashboard Visualization
Participants: Melissa Kenney, Michael Gerst, Toni Viskari, Austin Delaney, Freya Olsson, Carl Boettiger, Quinn Thomas
With the growth of the NEON Ecological Forecasting Challenge, we have outgrown the current Challenge Dashboard, which was designed to accommodate a smaller set of forecasts and synthesis questions. Thus, we have reenvisioned the next stage NEON Forecast Challenge Dashboard in order to facilitate the ability to answer a wider range of questions that forecast challenge users would be interested in exploring. The main audience for this dashboard is NEON forecasters, the EFI community, Forecast Synthesizers, and students in classes or teams participating in the NEON Ecological Forecasting Challenge. Given this audience, we have identified 3 different dashboard elements that will be important to include:
forecast synthesis overview,
summary metrics about the Forecast Challenge, and
self diagnostic platform.
To learn more about the dashboard redesign approach, see the prototypes here. Find more details about this project in this blog post.
Transporting Models Between NEON and non-NEON Systems
Participants: Brendan Allison, Olufemi Fatunsin, & Jeff Mintz
A community of practice is increasingly active in developing models and forecasts for NEON sites. We asked: how can we take models trained on NEON data and refine them for use in another context? Similarly, how can we take models trained on non-NEON data and refine them on NEON data? This goal of transplanting models can empower a range of applications, including local field studies, adaptive management, and data fusion from multiple monitoring networks, enabling greater statistical power for big ecological questions. Whether transporting a model to or from NEON, the challenges are effectively the same. These included unbalanced data, different monitoring protocols, different predictors, and different site selection criteria. To focus our efforts, we picked the particular case study of bringing together NEON vegetation survey data with similar datasets generated under the Forest Inventory Analysis (FIA) program. Our first product was the development of a Bayesian multilevel model with the capacity to scale to the integration of multiple sets of continental or global-scale monitoring networks, or shrink to the job of predicting outcomes at a single site, but informed by a shared global layer. With this case study in mind, we have been building a codebase for processing the relevant NEON and FIA forestry data and for joint modeling of residual error across monitoring systems in Stan, a popular probabilistic programming language. Find more details about this project in this blog post.
ML-based Uncertainty in the NEON Ecological Forecasting Challenge
Participants: Marcus Lapeyrolerie, Caleb Robbins
How can machine learning (ML) provide a solution to estimating forecast uncertainty across NEON Ecological Forecasting Challenge? We generated a proof-of-concept workflow combining two machine learning approaches to make probabilistic forecasts. Random forests were used to learn relationships between forecast challenge variables and past NOAA weather data and to make predictions. While these models were able to make forecasts that perform well in approximating the future target time series, they were not implemented to provide estimates of uncertainty. We explored how we could use past data along with these deterministic forecasts to generate probabilistic forecasts. Our approach was to train another machine learning model to make probabilistic forecasts on the residual errors from the previous Random Forest models. We then used these predicted residual error forecasts to modify the Random Forest-based forecasts. This combined approach holds potential as it could be used in a plug-n-play manner, where this method could correct the deterministic (or even probabilistic) forecasts from any model to account for temporal trends in the residual error and provide uncertainty estimates. In our next steps, we will work on creating an automated workflow to generate residual error forecasts for the Eco4Cast challenge.
Ground beetles are a versatile species with which to measure biodiversity, yet they lack behind other EFI NEON Ecological Forecasting Challenge themes in terms of forecasts and models. Our group at the Unconference wanted to figure out why forecasters were not submitting to the NEON Ecological Forecasting Challenge Beetle Communities Theme and how we could remove those barriers to increase forecast submission. We created a tutorial (in progress) that describes general goals for forecasting ecological communities, a how-to on submitting a forecast, some of the challenges in forecasting ecological community data, and examples of forecasts people might submit to begin to address those challenges. We first reviewed the underlying data structure of the pre-made targets file that had been developed for the forecasting challenge. We then combined currently available code for a null model, an ARIMA model, and an available tutorial for working with data from the Aquatics Challenge into a workable tutorial to prepare and submit forecasts to the Beetle Challenge. Our goal is to finalize the tutorial by adding a random walk model and more detail on how to add additional covariates to the model, including climate variables. We are also designing a new targets file that has different variables of interest at finer spatial scales at a given NEON site (e.g. plot or habitat information, survey effort). The beetles community data provides an example of when patterns in non-continuous or seasonal data may be poorly capture by a simple model (e.g., ARIMA). When there is latency or gaps in the data more data processing is often required than when using continuous sensor-captured data. Knowing the experimental design is also critical to be able to design a model to build understanding. We hope that this tutorial increases overall interest in submitting forecasts to the beetle forecasting challenge and removes barriers that may prevent forecasters at all levels from submitting. Further information and development on community ecology and biodiversity data is critical for understanding many different biological systems, can help researchers broaden their understanding of how and why communities change over time, and can better provide decision-making tools for ecosystem monitoring.
Towards Principles for Designing Inclusive Ecological Forecasts
Participants: Anna Sjodin, Mary Lofton, Sean Dorr, Jody Peters, Jason McLachlan, Cazimir Kowalski, Melissa Kenney, Katie Jones
Our group is interested in exploring opportunities for improving inclusivity in ecological forecasting. Through discussion, we identified the ten principles of Design Justice (Box. 1) as a potential mechanism for evaluating the inclusivity of forecast products, services, and systems.
We use design to sustain, heal, and empower our communities, as well as to seek liberation from exploitative and oppressive systems.
2
We center the voices of those who are directly impacted by the outcomes of the design process.
3
We prioritize design’s impact on the community over the intentions of the designer.
4
We view change as emergent from an accountable, accessible, and collaborative process, rather than as a point at the end of a process.
5
We see the role of the designer as a facilitator rather than an expert.
6
We believe that everyone is an expert based on their own lived experience, and that we all have unique and brilliant contributions to bring to a design process.
7
We share design knowledge and tools with our communities.
8
We work towards sustainable, community-led and -controlled outcomes.
9
We work towards non-exploitative solutions that reconnect us to the earth and to each other.
10
Before seeking new design solutions, we look for what is already working at the community level. We honor and uplift traditional, indigenous, and local knowledge and practices.
As a first step towards applying the Design Justice principles to EFI-created products, services, and systems, our team evaluated to what degree the ten principles were evident in the design of the NEON Ecological Forecasting Challenge. We identified several ways in which the design of the Challenge was well-aligned with Design Justice Principles (e.g., Principle 4: We view change as emergent from an accountable, accessible, and collaborative process, rather than as a point at the end of a process.), as well as areas in which we thought we could improve (e.g., Principle 3: We prioritize design’s impact on the community over the intentions of the designer).
Moving forward, we are soliciting broader participation from all EFI community members in small focus groups to continue our internal evaluation of the inclusivity of current EFI products, with the ultimate goal of furthering the inclusivity of ecological forecasting by developing recommendations towards a more complete alignment of EFI-designed products with design justice principles. If you are interested in participating in such a focus group, please provide your contact information in the Google Form linked here.
A proactive step toward decision-ready forecasts: Fusing iterative, near-term ecological forecasting and adaptive management
Participants: Jaime Ashander, LM Bradley, Mark Buckner, Nathan Byer, Cayelan Carey, Michael Gerst
This group aimed to improve the conceptual tools for co-production of ecological forecasts that aid in decision making. We identified that there is a need for tighter conceptual integration of the iterative, near-term ecological forecasting cycle (as practiced by the EFI community) with the adaptive management cycle (as practiced by communities of natural resource managers) and the broader context for management decisions. While prior frameworks have treated the iterative, near-term forecasting and adaptive management cycles as independent, with limited points of contact, a careful fusion of these processes may increase conceptual utility for co-production. As a first step towards a more useful framework, we then located iterative, near-term forecasting activities within the management decision making process, using the PrOACT (Problem, Objectives, Alternative Actions, Consequences, and Tradeoffs) tool from structured decision making. After creating this draft version of a framework, we explored several targeted case studies in ecological forecasting and adaptive management to evaluate its efficacy as a tool for fusing forecasting and adaptive management efforts. We will continue meeting to develop these ideas and work towards a manuscript.
Developing models to understand the transmission of pathogens in disease ecology is critical to understanding the spread of diseases and how to prevent them. A model study is relied on to simulate the spread of disease and predict the effectiveness of different control strategies. Model forecasting is also critical, both for planning and enacting public health interventions but also for building our understanding of the sometimes complex drivers of disease dynamics across space and time. Vector-transmitted diseases (e.g.,mosquito- or tick-borne) represent an exceptionally difficult case since key processes affecting spread and transmission are not directly reflected in typical public health monitoring. For example, the presence and behavior of the vector species themselves, but often there are infection reservoirs in wildlife populations as well. In this way, connecting ecological forecasts to human epidemiological forecasts is an important challenge to tackle.
The NEON Ecological Forecasting Challenge has already included a tick forecast challenge, although it has not yet been tied directly to tick pathogen status monitoring or human health. In this project, we worked on the West Nile Virus (WNV), which is a mosquito-borne disease in the family of flaviviruses. The primary host is birds (across a wide range of species), while humans are the dead-end host. WNV occurs and is commonly spread, especially in the summer, through mosquito bites. Our goal at the EFI Unconference was to examine the opportunities that NEON data could provide to create impactful forecasts for the public’s health from vector-borne diseases, focusing on WNV. Especially since humans are a dead-end host, understanding and forecasting the disease dynamics demands ecological, human, and human data. We intend to forecast the mosquito abundance as well as the infection rate in humans over time, incorporating the mosquito abundance, seasonality, drivers, and co-occurring bird abundances.
We built a preliminary bridge that connects National Ecological Observatory Network (NEON) and Center for Disease Control (CDC) data and, through preliminary visualization, demonstrated the potential to match between the NEON mosquito data (abundance and pathogen status) and CDC-reported human cases on a year-by-year and county-by-county level for 14 NEON sites located in counties with reported cases of WNV. A first look at the collected data set showed a relationship between the NEON bird and mosquito abundance that suggests large bird presence is one driving condition of large mosquito abundance in a summer sampling season. Given the relative rarity of WNV compared to some other vector-borne illnesses like Lyme disease, there are definitely some challenges to setting up a forecasting challenge for the full disease dynamics, although we may be able to cast a wider net for human cases in counties adjacent to NEON site counties. We’re excited to build this preliminary effort into a new neon4cast theme, and we’re also eager to dive into the lessons learned from one of the other Unconference projects that examined pitfalls in recruiting broad engagement in the beetle forecasting challenge.
Post by: Kelsey Yule; Project Manager, NEON Biorepository and Nico Franz; Principal Investigator, NEON Biorepository
Background. The National Ecological Observatory Network (NEON; https://www.neonscience.org/) is known for producing and publishing 180 (and counting) data products that are openly available to both researchers and the greater public. These data products span scales: individual organisms to whole ecosystems, seconds to decades, and meters to across the continent. They are proving to be a central resource for addressing ecological forecasting challenges. Less well known, however, is that these data products are all either directly the result of or spatially and temporally linked to NEON sampling of physical biological (e.g. microbial, plant, animal) and environmental (e.g. soil, atmospheric deposition) samples at all 81 NEON sites.
The NEON Biorepository at Arizona State University (Tempe, AZ) curates and makes available for research the vast majority of these samples, which consist of over 60 types and number over 100,000 per year. Part of the ASU Biodiversity Knowledge Integration Center and located at the ASU Biocollections, the NEON Biorepository was initiated in late 2018 and has received nearly 200,000 samples to date (corresponding to some 850 identified taxa in our reference classification). Sampling strategies and preservation methods that have resulted in the catalog of NEON Biorepository samples have been designed to facilitate their use in large scale studies of the ecological and evolutionary responses of organisms to change. While many of these samples, such as pinned insects and herbarium vouchers, are characteristic of biocollections, others are atypical and meant to serve researchers who may not have previously considered using natural history collections. These unconventional samples include: environmental samples (e.g. ground belowground biomass and litterfall, particulate mass filters; tissue, blood, hair and fecal samples; DNA extractions; and bulk, unidentified community-level samples (e.g. bycatch from sampling for focal taxa, aquatic and terrestrial microbes). Within the overarching NEON program, examination of these freely available NEON Biorepository samples is the path to forecasting some phenomena, such as the spread of disease and invasive species in non-focal taxonomic groups.
NEON Biorepository samples include: pinned, identified insects; dry soils; bulk, unidentified, ground-dwelling invertebrate community samples; frozen small mammal tissue samples
Sample Use. Critically, the NEON Biorepository can be contrasted with many other biocollections in the allowable and encouraged range of sample uses. For example, some sample types are collected for the express purpose of generating important datasets through analyses that necessitate consumption and even occasionally full destruction. Those of us at the NEON Biorepository are working to expedite sample uptake as early and often as possible. While we hope to maintain a decadal sample time series, we also recognize that the data potential inherent within these samples needs to be unlocked quickly to be maximally useful for ecological forecasting and, therefore, to decision making.
Data portal. In addition to providing access to NEON samples, the NEON Biorepository publishes biodiversity data in several forms on the NEON Biorepository data portal (https://biorepo.neonscience.org/portal/index.php). Users can interact with this portal in several ways: learn more about NEON sample types and collection and preservation methods; search and map available samples; download sample data in the form of Darwin Core records; find sample-associated data collected by other researchers; explore other natural history collections’ data collected from NEON sites; initiate sample loan requests; read sample and data use policies; and contribute and publish their own value-added sample-associated data. While more rapidly publishable NEON field data will likely be a first stop for forecasting needs, the NEON Biorepository data portal will be the only source for data products arising from additional analyses of samples collated across different research groups.
Map results for the spatial and taxonomic distribution of NEON mosquito (Culicidae) specimens currently available for use
Exploration of feasible forecasting collaborations. The NEON Biorepository faces both opportunities and challenges as it navigates its role in the ecological forecasting community. As unforeseen data needs arise, the NEON Biorepository will provide the only remaining physical records allowing us to measure relevant prior conditions. Yet, we are especially keen to collaboratively explore what kinds of forecasting challenges are possible to address now,particularly with regards to biodiversity and community level forecasts. And for those that are not possible now, what is missing and how can we collaborate to fill gaps in raw data and analytical methods? Responses to future forecasting challenges will be strengthened by understanding these parameters as soon as possible. We at the NEON Biorepository actively solicit inquiries by researchers motivated to tackle these opportunities, and our special relationship to NEON Biorepository data can facilitate these efforts. Please contact us with questions, suggestions, and ideas at biorepo@asu.edu.