December 4, 2023
Fullscreen ModeCategory Archives: Presentations
EFI at the Ecological Society of America 2023 Conference
Date: July 26, 2023
EFI is excited about the opportunity to connect with the broader community through a number of events at ESA in Portland this year! Below are details about a workshop about the NEON Forecasting Challenge, the EFI Social, and the EFI organized oral session. Other ecological forecasting talks are also listed.
For the first time, we will also have EFI badges to add to your name tags!
We will continue to make updates to this page prior to ESA. All times listed below are in US Pacific Time.
EFI Badges
We will have EFI badges that can be attached to the ESA name tags available for individuals who are part of the Ecological Forecasting Initiative community. Find Mike Dietze or Anna Sjodin during the Conference or at the EFI-sponsored Organized Oral Session on Tuesday or the EFI Social on Wednesday to get a badge and look for others with the green badge!
EFI Social
Wednesday, August 9 at 6:30-8:00 PM
Meet up with others in the EFI community on Wednesday evening, August 9 from 6:30-8:00 pm at the Cartside Food Carts. Cartside has a range of food and drink options and is a less than 15-minute walk from the Convention Center.
Workshop: Can You Predict the Future? Introducing the NEON Ecological Forecasting Challenge
Monday, August 7 at 11:45 AM – 1:15 PM; Location: C124
Freya Olsson (Virginia Tech) will be leading this 90-minute workshop that will be of interest to the EFI community. The workshop is perfect for those who want to know more about getting involved in the NEON Ecological Forecasting Challenge and will provide participants with materials and information to get them started. The primary goals of the session are to 1) introduce the Challenge and forecast themes; 2) familiarize participants with Challenge documentation as well as easy-to-use software, tools, and templates that have been developed in the R programming language; and 3) and facilitate participants in submitting their own forecast to the Challenge! We will provide a template forecasting workflow in R, using the daily terrestrial fluxes of carbon and evaporation theme as an example (neon4cast.org), and provide assistance to participants to set up their own forecasts. You can make sure you are ready to go for the workshop by looking at the draft materials here.
If you have questions about the workshop or set up instructions, please email freyao@vt.edu.
EFI Organized Oral Session: Ecological Forecasting: Applications, Discoveries, and Opportunities
Tuesday, August 8 at 1:30-3:00 PM; Location: 256
- 1:30 PM: Juniper Simonis (Dapper Stats, Inc.) – Forecasting desert rodent population dynamics in a changing climate
- 1:45 PM: Alexa Fredston (University of California, Santa Cruz) – Spatial ecological forecasting: applications to marine fish range dynamics
- 2:00 PM: Joanna Blaszczak (University of Nevada) – Anticipating the timing and magnitude of cyanotoxin production by benthic cyanobacteria in rivers
- 2:15 PM: Lynda Bradley (Emory University) – Predicting host-parasite dynamics after resource pulses: From host physiology to community infection risk
- 2:30 PM: Helene Genet (University of Alaska, Fairbanks) – Reducing model uncertainty of the permafrost carbon climate feedback through parameter optimization
- 2:45 PM: Diego Ellis-Soto (Yale University) – Data integration for ecological forecasting: Elevational and physiological offsets improve species distribution models
Other Forecasting Presentations
If you are presenting an ecological forecasting-related talk or poster that you don’t see on the list, reach out so we can get it added!
Monday, August 7
- 4:30-4:45 PM: Michael Stemkovski, Location: C125-126. Session: Climate Change: Communities 2. Quantifying the timescales and functional consequences of ecosystem acclimation lags
Tuesday, August 8
- 10:15-10:30 AM: Jorge Arroyo-Esquivel, Location B117. Session: Back and Forecasting in Ecology. Using neural ordinary differential equations to predict complex ecological dynamics from population density data
- 10:30-10:45 AM: Freya Olsson, Location: B117. Session: Back and Forecasting in Ecology. A multi-model ensemble of empirical and process-based models improves the predictive skill of near-term lake forecasts
- 10:45-11:00 AM: Kayode Oshinubi, Location: E144. Session: Population Dynamics: Modeling 4.
The effects of nonlinear averaging of temperature on population growth varies across diverse species - 11:00-11:15 AM: Michael Dietze, Location: B117. Session: Back and Forecasting in Ecology. Landscape-scale iterative forecasting of terrestrial carbon pools and fluxes : a Harvard Forest testbed
- 5:00 – 6:30 PM: Mary Lofton, Location: ESA Exhibit Hall. Poster Session: Modeling.
A multi-model ensemble to explore the limits of phytoplankton bloom prediction - 5:00 – 6:30 PM: Whitney Woelmer, Location: ESA Exhibit Hall. Poster Session: Modeling.
Iterative near-term ecological forecasts provide new insight into the predictability of multiple water quality variables over time and space
Wednesday, August 9
- 8:00 – 9:30 AM: Mary Lofton, Location: C124. Workshop.
Teach Quantitative Reasoning and Ecological Forecasting to Undergraduates with Project EDDIE and Macrosystems EDDIE Modules - 1:30-1:45 PM: Whitney Woelmer, Location: D140. Session: Education: Research and Assessment.
Embedding communication concepts in forecasting training increases students’ understanding of ecological uncertainty - 2:00-2:15 PM: Charlotte Malmborg, Location: D137. Session: Invasion 3.
Moving towards forecasting forest canopy recovery rates and trajectories following invasive insect pest defoliation events - 2:30-2:45 PM: Mary Lofton, Location: D140. Session: Education: Research and Assessment.
Macrosystems EDDIE: A modular curriculum to teach undergraduates ecological forecasting using R Shiny applications improves student confidence, familiarity, and conceptual understanding - 3:30-3:50 PM: Olivia Tabares, Location: 255. Session: We Are Stronger Together: Building Community to Face Barriers for Latin American and Underrepresented Ecologists Symposium.
Culturally relevant teaching: experiences from the Ecological Forecasting Initiative working with Latinx and Native-American students and teachers
Thursday, August 10
- 10:30-10:45 AM: Zoey Werbin, Location: D133-134. Session: Soil 2.
Forecasting the soil microbiome across the United States - 1:30-1:45 PM: Rachel Harman, Location: B114. Session: Populations 1.
Shifts in range of the invasive stored product insect pest, Prostephanus truncatus, under climate change - 3:30-3:34 PM: Felipe Montealegre-Mora, Location: E141. Session: Fisheries Management & Models 2.
Pretty darn good control: when are approximate solutions better than approximate models
Collaborative Innovation and Skill-building at the 2023 Unconference: Empowering Ecological Forecasting with NEON Data
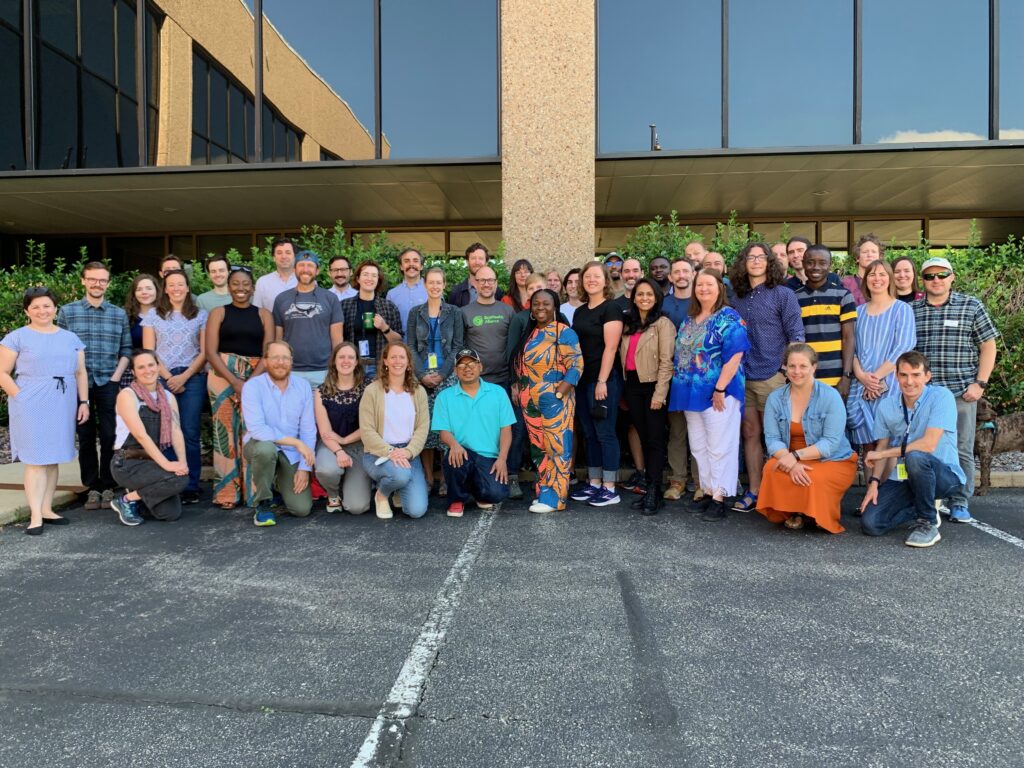
The 2023 EFI Unconference, hosted by the Ecological Forecasting Initiative Research Coordination Network (EFI RCN) and supported by the National Science Foundation, brought together 45 passionate individuals at the National Ecological Observatory Network (NEON) headquarters in Boulder, Colorado on June 21-23, 2023 to work on a diverse range of projects that were nominated and selected by the participants. With a focus on collaborative problem-solving, the Unconference fostered a unique environment for participants to exchange knowledge, generate new approaches, and advance the field of ecological forecasting.
In addition to project development, activities included a warm welcome from Kate Thibault, NEON Science Lead, icebreaker activities, expertly facilitated by Cayelan Carey from Virginia Tech that helped participants connect and form meaningful relationships, a tour of NEON facilities, and a poster session and social hour, where participants showcased their research and projects. Through these activities, Unconference participants and NEON staff were able to engage with one another, exchange feedback, and forge new collaborations.
To ensure a productive and focused Unconference, participants engaged in a review of project ideas and subsequent project selection. This process allowed attendees to propose projects aligned with their interests and expertise and fostered a sense of ownership and investment in the outcomes. Ten project groups developed out of the 24 that were initially proposed as part of the pre-meeting preparation.
Summaries provided by each project working group are listed below. Some groups will provide additional details in forthcoming blog posts, so be sure to watch for those future posts.
This was the first in-person EFI event since 2019 and it was absolutely lovely to be in the same room to meet new people and to see in-person people we had only seen on Zoom before. We appreciate the Unconference participants’ willingness to share their time, talents, and perspectives. As you will read below, there were a number of accomplishments over the three days of the meeting and we look forward to seeing future outcomes from what was developed at the Unconference!
List of Projects
- Spatially Explicit Forecasting
- Forecast Uncertainty
- Forecasting Impacts: Measuring the Current and Future Impacts of EFI
- Reenvisioning the NEON Ecological Forecasting Challenge Dashboard Visualization
- Transporting Models Between NEON and Non-NEON Systems
- ML-based Uncertainty in the NEON Ecological Forecasting Challenge
- Forecasting Ground Beetles: Avoiding Pitfalls
- Towards Principles for Designing Inclusive Ecological Forecasts
- A proactive step toward decision-ready forecasts: Fusing iterative, near-term ecological forecasting and adaptive management
- Disease Forecasting
Spatially Explicit Forecasting
Participants: John Smith, David Durden, Emma Mendelsohn, Carl Boettiger
To date, the NEON Ecological Forecasting Challenge has been focused on generating near term forecasts for specific sites. However, many interesting ecological phenomena occur across both time and space. At the EFI 2023 Unconference, our group prototyped a forecasting challenge that is also spatially explicit. For our prototype forecasting challenge, we focused on Leaf Area Index (LAI) recovery in post-burn areas. Our focal sites so far include the California August complex fire and the Colorado East Troublesome fire. Our work at the Unconference focused on building cyber-infrastructure to ingest and aggregate data, build target files, assess models using proper scoring rules, and build baseline climatological forecasts. Current progress, including an example notebook and a detailed workflow diagram, are available on GitHub: https://github.com/eco4cast/modis-lai-forecast/. Current and future work includes building additional baseline models, setting up a submission portal using GitHub actions, and integrating additional sites to include a variety of ecoclimatic domains.
Go back to the list of projects.
Forecast uncertainty
Participants: Noam Ross, Eli Horner, Ashley Bonner, Mike Dietze, Chris Jones
Interest and use of ecological forecasting have increased in recent years due in large part to the efforts of EFI, including the NEON Ecological Forecasting Challenge. However, only a small percentage of ecological forecasts published have fully quantified and partitioned their forecast uncertainties. Quantifying and validating model predictions and uncertainties allows for understanding the degree of uncertainty in forecasts and how much we understand the underlying ecological system (our ability to predict them). Partitioning forecast uncertainties allows for increased focus on data collection efforts that could lead to improved model performance and reduction in uncertainty. Our group worked toward creating a tutorial for how to quantify and partition forecast uncertainties and validate model predictions with uncertainty by using the NEON Phenology Forecasting Challenge. We are using an ARIMA model and a random forest model as examples. During the Unconference we were able to get both models working and partition uncertainties. We are finishing up the code base, tutorial, and discussing challenges with each type of model when it comes to performing uncertainty quantification and partition.
Go back to the list of projects.
Forecasting Impacts: Measuring the Current and Future Impacts of EFI
Participants: Rebecca Finger-Higgens, Jessica Burnett, Alexis O’Callahan, Ayanna St. Rose
It turns out getting-to-know-you style ice breakers can provide more than just a few new friends, they can also demonstrate group priorities and motivations for coming together in the first place. On a sunny morning at the NEON Headquarters in Boulder, CO, Cayelan Carey (Virginia Tech) asked the group of EFI Unconference participants to organize themselves based on whether they individually felt that the goal of forecasts were for understanding or decision making. As the participants shuffled around and considered the question before them, the final results revealed a pattern among the group that resembled a skewed desire for forecasts to inform decision making versus broadening the understanding of ecological systems. However, the ability of ecological forecasts to effectively inform decision making has not clearly been measured. Besides directly impacting decision making processes, how do we, as a grassroots organization, recognize and measure the other societal impacts that EFI might be, or capable, of creating?
This led our group to think through ways that EFI could measure impacts, to ask: what are the impact goals and achievements of EFI, what does the community want out of EFI, and what is the best way to measure these often hard to measure metrics? Using five categories of societal impacts (instrumental applications, connectivity impacts, conceptual impacts, capacity building, and socio-ecological impacts), we developed a poll for Unconference participants to assess the priorities and current thoughts of this representative group. The poll results suggest that EFI community goals emphasize conceptual impacts (i.e. improve ecological understanding), connectivity impacts (i.e. maintaining and developing community and partnerships) and instrumental applications (i.e., applications for decision making). We also found that EFI has made the greatest advancements in capacity building (i.e., curriculum development, short courses), conceptual impacts (i.e., working groups), and connectivity impacts (i.e., newsletters and conference sessions). These discoveries have allowed us to identify a space for the creation of a concrete link between the connectivity of forecasting and the desired application outcomes of the group. It has allowed us to develop a number of recommendations for the steering committee and the EFI community. Some of these recommendations include focusing on if, how, and why a created forecast product achieves one of the five predefined societal benefits. Together, we hope to continue to build on the vision statement of EFI to build forecasts to understand, manage, and conserve ecosystems in a measurable and remarkable way.
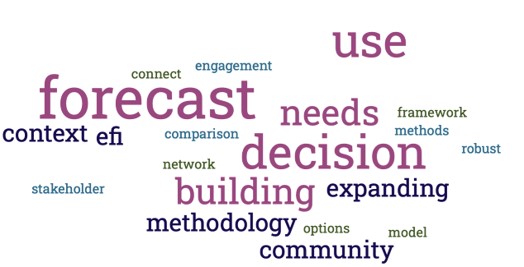
Figure 1: Word cloud generated from Unconference participant responses to the question “describe the potential, importance, or value of the community of EFI”.
Go back to the list of projects.
Reenvisioning the NEON Ecological Forecasting Challenge Dashboard Visualization
Participants: Melissa Kenney, Michael Gerst, Toni Viskari, Austin Delaney, Freya Olsson, Carl Boettiger, Quinn Thomas
With the growth of the NEON Ecological Forecasting Challenge, we have outgrown the current Challenge Dashboard, which was designed to accommodate a smaller set of forecasts and synthesis questions. Thus, we have reenvisioned the next stage NEON Forecast Challenge Dashboard in order to facilitate the ability to answer a wider range of questions that forecast challenge users would be interested in exploring. The main audience for this dashboard is NEON forecasters, the EFI community, Forecast Synthesizers, and students in classes or teams participating in the NEON Ecological Forecasting Challenge. Given this audience, we have identified 3 different dashboard elements that will be important to include:
- forecast synthesis overview,
- summary metrics about the Forecast Challenge, and
- self diagnostic platform.
To learn more about the dashboard redesign approach, see the prototypes here. Find more details about this project in this blog post.
Go back to the list of projects.
Transporting Models Between NEON and non-NEON Systems
Participants: Brendan Allison, Olufemi Fatunsin, & Jeff Mintz
A community of practice is increasingly active in developing models and forecasts for NEON sites. We asked: how can we take models trained on NEON data and refine them for use in another context? Similarly, how can we take models trained on non-NEON data and refine them on NEON data? This goal of transplanting models can empower a range of applications, including local field studies, adaptive management, and data fusion from multiple monitoring networks, enabling greater statistical power for big ecological questions. Whether transporting a model to or from NEON, the challenges are effectively the same. These included unbalanced data, different monitoring protocols, different predictors, and different site selection criteria. To focus our efforts, we picked the particular case study of bringing together NEON vegetation survey data with similar datasets generated under the Forest Inventory Analysis (FIA) program. Our first product was the development of a Bayesian multilevel model with the capacity to scale to the integration of multiple sets of continental or global-scale monitoring networks, or shrink to the job of predicting outcomes at a single site, but informed by a shared global layer. With this case study in mind, we have been building a codebase for processing the relevant NEON and FIA forestry data and for joint modeling of residual error across monitoring systems in Stan, a popular probabilistic programming language. Find more details about this project in this blog post.
Go back to the list of projects.
ML-based Uncertainty in the NEON Ecological Forecasting Challenge
Participants: Marcus Lapeyrolerie, Caleb Robbins
How can machine learning (ML) provide a solution to estimating forecast uncertainty across NEON Ecological Forecasting Challenge? We generated a proof-of-concept workflow combining two machine learning approaches to make probabilistic forecasts. Random forests were used to learn relationships between forecast challenge variables and past NOAA weather data and to make predictions. While these models were able to make forecasts that perform well in approximating the future target time series, they were not implemented to provide estimates of uncertainty. We explored how we could use past data along with these deterministic forecasts to generate probabilistic forecasts. Our approach was to train another machine learning model to make probabilistic forecasts on the residual errors from the previous Random Forest models. We then used these predicted residual error forecasts to modify the Random Forest-based forecasts. This combined approach holds potential as it could be used in a plug-n-play manner, where this method could correct the deterministic (or even probabilistic) forecasts from any model to account for temporal trends in the residual error and provide uncertainty estimates. In our next steps, we will work on creating an automated workflow to generate residual error forecasts for the Eco4Cast challenge.
Go back to the list of projects.
Forecasting Ground Beetles: Avoiding Pitfalls
Participants: Eric Sokol, Glenda Wardle, Vihanga Gunadasa, Juniper Simonis, Alison Gerken, Meghan Beatty, Khum Thapa-Magar
Ground beetles are a versatile species with which to measure biodiversity, yet they lack behind other EFI NEON Ecological Forecasting Challenge themes in terms of forecasts and models. Our group at the Unconference wanted to figure out why forecasters were not submitting to the NEON Ecological Forecasting Challenge Beetle Communities Theme and how we could remove those barriers to increase forecast submission. We created a tutorial (in progress) that describes general goals for forecasting ecological communities, a how-to on submitting a forecast, some of the challenges in forecasting ecological community data, and examples of forecasts people might submit to begin to address those challenges. We first reviewed the underlying data structure of the pre-made targets file that had been developed for the forecasting challenge. We then combined currently available code for a null model, an ARIMA model, and an available tutorial for working with data from the Aquatics Challenge into a workable tutorial to prepare and submit forecasts to the Beetle Challenge. Our goal is to finalize the tutorial by adding a random walk model and more detail on how to add additional covariates to the model, including climate variables. We are also designing a new targets file that has different variables of interest at finer spatial scales at a given NEON site (e.g. plot or habitat information, survey effort). The beetles community data provides an example of when patterns in non-continuous or seasonal data may be poorly capture by a simple model (e.g., ARIMA). When there is latency or gaps in the data more data processing is often required than when using continuous sensor-captured data. Knowing the experimental design is also critical to be able to design a model to build understanding. We hope that this tutorial increases overall interest in submitting forecasts to the beetle forecasting challenge and removes barriers that may prevent forecasters at all levels from submitting. Further information and development on community ecology and biodiversity data is critical for understanding many different biological systems, can help researchers broaden their understanding of how and why communities change over time, and can better provide decision-making tools for ecosystem monitoring.
Go back to the list of projects.
Towards Principles for Designing Inclusive Ecological Forecasts
Participants: Anna Sjodin, Mary Lofton, Sean Dorr, Jody Peters, Jason McLachlan, Cazimir Kowalski, Melissa Kenney, Katie Jones
Our group is interested in exploring opportunities for improving inclusivity in ecological forecasting. Through discussion, we identified the ten principles of Design Justice (Box. 1) as a potential mechanism for evaluating the inclusivity of forecast products, services, and systems.
Box 1: Design Justice Network Principles, reproduced from https://designjustice.org/read-the-principles, license CC BY-ND 4.0.
To learn more, please visit the Design Justice Network website (https://designjustice.org) or see Design Justice: Community led practices to build the world we need by Sasha Costanza-Chock (https://designjustice.mitpress.mit.edu/;
open access pdf version is available here: https://library.oapen.org/bitstream/handle/20.500.12657/43542/1/external_content.pdf).
| 1 | We use design to sustain, heal, and empower our communities, as well as to seek liberation from exploitative and oppressive systems. |
| 2 | We center the voices of those who are directly impacted by the outcomes of the design process. |
| 3 | We prioritize design’s impact on the community over the intentions of the designer. |
| 4 | We view change as emergent from an accountable, accessible, and collaborative process, rather than as a point at the end of a process. |
| 5 | We see the role of the designer as a facilitator rather than an expert. |
| 6 | We believe that everyone is an expert based on their own lived experience, and that we all have unique and brilliant contributions to bring to a design process. |
| 7 | We share design knowledge and tools with our communities. |
| 8 | We work towards sustainable, community-led and -controlled outcomes. |
| 9 | We work towards non-exploitative solutions that reconnect us to the earth and to each other. |
| 10 | Before seeking new design solutions, we look for what is already working at the community level. We honor and uplift traditional, indigenous, and local knowledge and practices. |
As a first step towards applying the Design Justice principles to EFI-created products, services, and systems, our team evaluated to what degree the ten principles were evident in the design of the NEON Ecological Forecasting Challenge. We identified several ways in which the design of the Challenge was well-aligned with Design Justice Principles (e.g., Principle 4: We view change as emergent from an accountable, accessible, and collaborative process, rather than as a point at the end of a process.), as well as areas in which we thought we could improve (e.g., Principle 3: We prioritize design’s impact on the community over the intentions of the designer).
Moving forward, we are soliciting broader participation from all EFI community members in small focus groups to continue our internal evaluation of the inclusivity of current EFI products, with the ultimate goal of furthering the inclusivity of ecological forecasting by developing recommendations towards a more complete alignment of EFI-designed products with design justice principles. If you are interested in participating in such a focus group, please provide your contact information in the Google Form linked here.
Go back to the list of projects.
A proactive step toward decision-ready forecasts: Fusing iterative, near-term ecological forecasting and adaptive management
Participants: Jaime Ashander, LM Bradley, Mark Buckner, Nathan Byer, Cayelan Carey, Michael Gerst
This group aimed to improve the conceptual tools for co-production of ecological forecasts that aid in decision making. We identified that there is a need for tighter conceptual integration of the iterative, near-term ecological forecasting cycle (as practiced by the EFI community) with the adaptive management cycle (as practiced by communities of natural resource managers) and the broader context for management decisions. While prior frameworks have treated the iterative, near-term forecasting and adaptive management cycles as independent, with limited points of contact, a careful fusion of these processes may increase conceptual utility for co-production. As a first step towards a more useful framework, we then located iterative, near-term forecasting activities within the management decision making process, using the PrOACT (Problem, Objectives, Alternative Actions, Consequences, and Tradeoffs) tool from structured decision making. After creating this draft version of a framework, we explored several targeted case studies in ecological forecasting and adaptive management to evaluate its efficacy as a tool for fusing forecasting and adaptive management efforts. We will continue meeting to develop these ideas and work towards a manuscript.
Go back to the list of projects.
Disease Forecasting
Participants: Janet Agbaje, Kayode Oshinubi, Ethan Deyle (and thanks Ayanna St. Rose!)
Developing models to understand the transmission of pathogens in disease ecology is critical to understanding the spread of diseases and how to prevent them. A model study is relied on to simulate the spread of disease and predict the effectiveness of different control strategies. Model forecasting is also critical, both for planning and enacting public health interventions but also for building our understanding of the sometimes complex drivers of disease dynamics across space and time. Vector-transmitted diseases (e.g.,mosquito- or tick-borne) represent an exceptionally difficult case since key processes affecting spread and transmission are not directly reflected in typical public health monitoring. For example, the presence and behavior of the vector species themselves, but often there are infection reservoirs in wildlife populations as well. In this way, connecting ecological forecasts to human epidemiological forecasts is an important challenge to tackle.
The NEON Ecological Forecasting Challenge has already included a tick forecast challenge, although it has not yet been tied directly to tick pathogen status monitoring or human health. In this project, we worked on the West Nile Virus (WNV), which is a mosquito-borne disease in the family of flaviviruses. The primary host is birds (across a wide range of species), while humans are the dead-end host. WNV occurs and is commonly spread, especially in the summer, through mosquito bites. Our goal at the EFI Unconference was to examine the opportunities that NEON data could provide to create impactful forecasts for the public’s health from vector-borne diseases, focusing on WNV. Especially since humans are a dead-end host, understanding and forecasting the disease dynamics demands ecological, human, and human data. We intend to forecast the mosquito abundance as well as the infection rate in humans over time, incorporating the mosquito abundance, seasonality, drivers, and co-occurring bird abundances.
We built a preliminary bridge that connects National Ecological Observatory Network (NEON) and Center for Disease Control (CDC) data and, through preliminary visualization, demonstrated the potential to match between the NEON mosquito data (abundance and pathogen status) and CDC-reported human cases on a year-by-year and county-by-county level for 14 NEON sites located in counties with reported cases of WNV. A first look at the collected data set showed a relationship between the NEON bird and mosquito abundance that suggests large bird presence is one driving condition of large mosquito abundance in a summer sampling season. Given the relative rarity of WNV compared to some other vector-borne illnesses like Lyme disease, there are definitely some challenges to setting up a forecasting challenge for the full disease dynamics, although we may be able to cast a wider net for human cases in counties adjacent to NEON site counties. We’re excited to build this preliminary effort into a new neon4cast theme, and we’re also eager to dive into the lessons learned from one of the other Unconference projects that examined pitfalls in recruiting broad engagement in the beetle forecasting challenge.
EFI Newsletter Issue 25
EFI Futures Outstanding Student Presentation Award 2022 Results
At the May 2022 EFI Virtual Conference we debuted the EFI Futures Outstanding Student Presentation Award. This award is given to promote, recognize, and reward an outstanding student presenter and provides valuable feedback to student presenters on their research and presentation skills. Students presenting both Posters and Oral Presentations were eligible for this award. Each poster or oral presentation were anonymously reviewed by at least two volunteer reviewers with no conflicts of interest with the presenters. In addition to being recognized for their outstanding work, award winners received $50 to spend at the EFI shop. We thank all the students who presented and the volunteers who reviewed the presentations!
Congratulations to this year’s Outstanding Presentation Award recipients!
- Yiluan Song (University of California, Santa Cruz) won for her oral presentation, “Ecological forecasting of leafing and flowering phenology during climate change to inform public health” and
- Whitney Woelmer (Virginia Tech) won for her poster “Undergraduate student confidence and understanding of ecological forecasting concepts significantly increases after completing a Macrosystems EDDIE module.”
See Yiluan and Whitney’s presentation, poster and abstracts below.
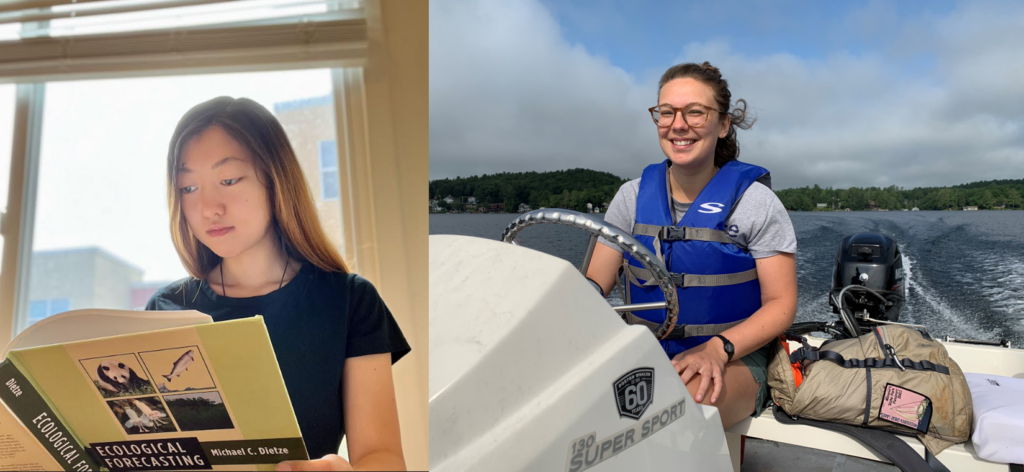
In her presentation, Yiluan introduced her pollen phenology forecast used for public health that leverages the rapidly accumulating data on leafing phenology with a nonlinear, data-driven model. Yiluan and her co-authors established a workflow for data assembly, prediction, and delivery and use the PhenoForecast platform to deliver forecasts of plant phenology and to communicate pollen allergy risks. The platform is not available online yet, but Yiluan and her collaborators are working toward that end.
In her poster, Whitney shared an overview of Module 8 of the Macrosystems EDDIE suite of educational modules that introduce students to concepts of macrosystems ecology, ecological forecasting, and quantitative literacy skills. This module in particular focuses on introducing decision-support and uncertainty communication skills, in addition to general ecological forecasting concepts and applications. Whitney’s poster also demonstrates how the effectiveness of the modules was assessed and how they increase students’ engagement and understanding of complex concepts.
Fullscreen ModeABSTRACTS
Ecological Forecasting of Leafing and Flowering Phenology During Climate Change to Inform Public Health
Yiluan Song1, Stephan B. Munch2,3,4, Kai Zhu1
1University of California, Santa Cruz, 2Southwest Fisheries Science Center, 3National Marine Fisheries Service, 4National Oceanic and Atmospheric Administration
Changes in plant phenology caused by climate change have important implications not only in ecology but also in public health. Global warming has led to an extended pollen season and increased pollen abundance. Exposure to pollen imposes significant costs on public health and is likely to exacerbate under future environmental change. The elevating risks from phenological shift calls for major improvements in the prediction of phenology and the understanding of driving mechanisms. The success in the prediction of phenology has been limited by the performance of phenology models, in particular, a mismatch between the common linear modeling approach and the nonlinear mechanisms. Traditional models with linear structures often fail to accurately predict phenology, as mechanisms of phenology can be highly nonlinear. Models that address nonlinear mechanisms with data-driven machine learning approaches are needed to overcome the limitations in phenology models. To model the nonlinear mechanisms of leafing and flowering phenology, we adopt a state-of-the-art machine learning method, Gaussian Process empirical dynamic modeling (GP-EDM). By forecasting leafing phenology observed with satellite remote sensing (MODIS) and near-surface camera imagery (PhenoCam) in the near term (as part of the EFI RCN NEON Ecological Forecast Challenge), we validate that our approach reveals complex causal relationships from time series and outperforms parametric alternatives in prediction. Applying our ecological forecasting method, we forecast the leafing and flowering phenology of four tree taxa that produce allergenic pollen at high spatial and temporal resolution (0.05 deg and daily) over the continental US. These forecasts, published daily through a Shiny App, serve to provide early allergy health advisories and warnings, which can limit pollen exposure and reduce healthcare costs. Further, the interactive query of plant phenology on the web app can raise awareness of the impacts of climate change on our health and the ecosystem. Overall, this project develops cutting-edge machine learning models for forecasting plant phenology and is a step towards mitigating the adverse impacts of unprecedented climate changes on public health.
Undergraduate Student Confidence and Understanding of Ecological Forecasting Concepts Significantly Increases after Completing a Macrosystems EDDIE Module
Whitney Woelmer1
1Virginia Tech
Ecological forecasting is an emerging approach to estimate future states of ecological systems with uncertainty, allowing society to prepare for and manage ecosystem services. Despite the increasing need to understand, create, and communicate forecasts, forecasting training has previously focused on graduate students, representing a gap in training undergraduate students as the next generation of ecologists. In response, we developed a hands-on teaching module within the Macrosystems EDDIE (Environmental Data-Driven Inquiry & Exploration; MacrosystemsEDDIE.org) educational program to introduce ecological forecasting and forecast communication to undergraduate students through an RShiny application. Tested with >250 undergraduate students, our assessment results suggest that the module significantly increased students’ ability to correctly define ecological forecasting terms, interpret forecast visualizations with uncertainty, and identify different ways to communicate forecast uncertainty for stakeholders. These results suggest that integrating ecological forecasting into undergraduate ecology curricula via software-based learning enhances students’ abilities to engage and understand complex ecological concepts.
Serious Fun: Reimagining Virtual Events Recap
December 2, 2021
Post by Jody Peters
The EFI Partner’s Working Group hosted Pablo Suarez on November 19 for an intensely participatory Zoom call session titled “Serious Fun: Reimagining Virtual Events on Ecological Forecasting”. This was the first of a 2-part series on science communication. The second session, “Sharing is Caring: Communicating Science Beyond Academic Publications” will be held on January 19. You can find details and register for the January session here.
The first session on November 19 was not recorded due to the intensely participatory nature of the call. However, below we share an overview of the call and resources shared by Pablo.
Pablo Suarez is innovation lead at the Red Cross Red Crescent Climate Centre, a visiting fellow at Boston University, and an artist in residence at the National University of Singapore. He directs the Climate Centre’s initiatives linking applied knowledge with humanitarian work, as well as new approaches to climate risk management. Examples of his work include participatory games for learning about climate change and dialogue, and forecast-based financing pilots in Togo and Uganda.
Pablo started with the premise that disasters are collaborating better than humans are – for example, things like the pandemic, climate issues, and conflicts are exponentially causing harm and we need to have better collaborations between those who know and those who do. And if we want to effectively work with other scientists, people impacted by what we study, or policymakers, we need to let people know how much we care about what they care about. Often we convey information and work to develop collaborations through meetings and presentations typically with a keynote or series of talks followed by a short Q&A session. Pablo advocated that there are better ways to communicate and develop collaborations during meetings and conferences and that is by using games and including humor and spontaneity as a way to broaden engagement and make connections.
As I worked with Pablo to coordinate the logistics for the call and compile the advertising material, I didn’t grasp what the “Serious Fun” part of his talk title meant. But after participating on the call, I am inspired to think about ways to incorporate his suggestions for reimagining virtual events which are low-carbon and low-budget compared to in-person events. We know Zoom fatigue is real, but by including spontaneity, humor, and games, virtual events can be more engaging and can lead to deepened networks and collective action. By having fun, we can be more effective at conveying serious ideas about science, ecological forecasting, and making decisions.
Below I describe the two major activities held during the call and end with a list of the resources Pablo shared.
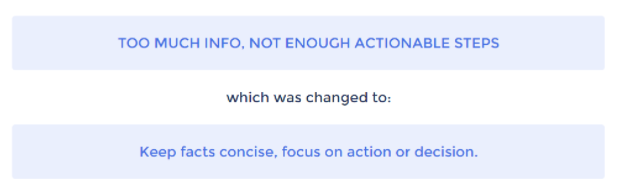
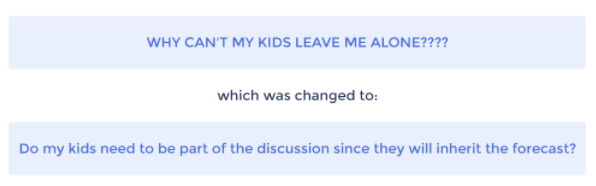
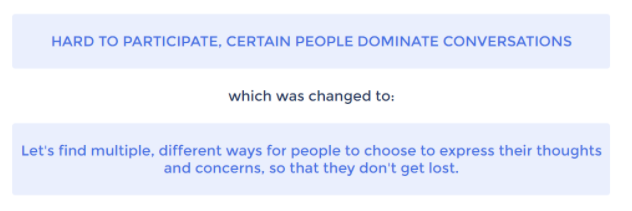
1. Rant
One group activity was called Rant. Early on in the call, we had a short amount of time to write out all our frustrations with Zoom calls. It was fast-paced and Pablo really encouraged us to get into the Rant by expressing our frustrations through things like capitalization, exclamation marks, etc. Later after other activities in the call, we had the opportunity to go back to rants submitted by ourselves and by others on the call to think about changes that could be made to alleviate issues with Zoom calls. You can see a few example rants and changes below and you can find all the rants here. I particularly appreciated the second example below, since that was my rant.
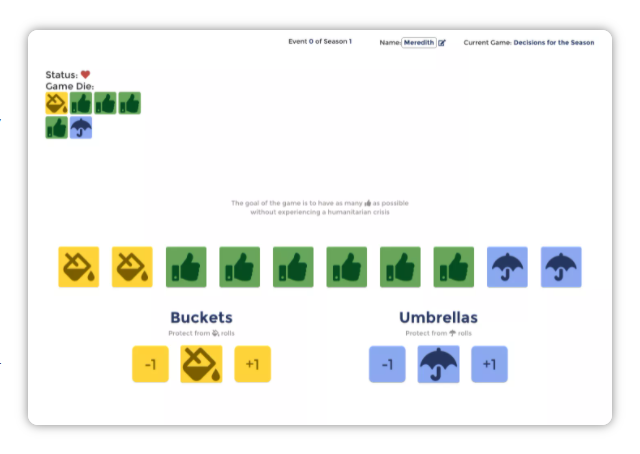
2. Decisions for Seasons
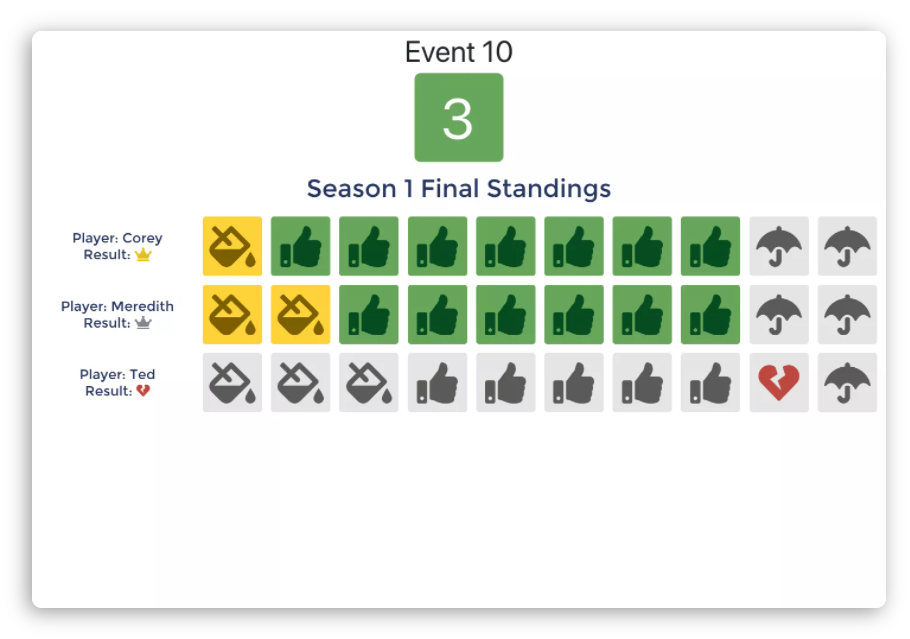
The other major activity Pablo facilitated was a version of Decisions for Seasons, a game designed to support learning and dialogue about key aspects of planning for extremes and experiencing climate change impacts and managing risk. In this game, everyone had 10 forecasts about the climate conditions for the next year. We could choose if the conditions would be regular/normal (thumbs up) or if we should plan for drought insurance (buckets) or flood insurance (umbrellas). This game was also fast-paced with only about a minute to make these decisions. After everyone had made their predictions about the future conditions, Pablo rolled a die where a 1 meant there was a drought and a 6 meant there was a flood and we all hoped we had picked enough drought or flood insurance to handle those rolls! The fun part was then seeing whose predictions were correct and who ended up getting broken hearts for incorrect predictions (see the second image below). Although we didn’t have time during our call, an extension to this game is to incorporate climate change by using an 8-sided die where floods become represented by a 6, 7, or 8 increasing the chance of an extreme event. You can find more details about how this game can be played here.
Throughout the call we had fun, there were moments of heart-racing tension to get our predictions and answers in, there were opportunities for competition and collaboration, and plenty of joy. But there was also a seriousness moving forward to think about what we are doing with forecasts, how we can improve forecasts, how we can improve people’s access, understanding, and opportunity to act, and how we can enable people to make decisions with forecasts.
While this seminar focused on how to make virtual events more engaging, Pablo’s suggestions and resources can also be applied to in-person conferences and meetings, classes, and lab meetings. Let’s have more fun, let’s be more engaged!
Resources
For those interested in exploring how to incorporate games into your presentations and to find ways to make your audiences know you care about what they care about, the following are resources Pablo shared during the call.
- The Climate Centre’s website has lots of resources (climatecentre.org). In particular, there is a section about humour and a number of climate games.
- There are almost 30 climate games applicable for small to large groups (n=6-100) and that cover a range of topics including climate change adaptation and mitigation, collaboration, disaster risk reduction, health, resilience, etc. Each game includes learning objectives, intended audiences, required materials, and pdf and video tutorials. A number of the games specifically connect to forecasting and decision making incuding the Decisions for Seasons game we played during the call. Two other examples include
- Before the Storm – a decision-making game designed to introduce weather forecasts and possible actions to take against natural disasters through different roles.
- Paying for Predictions – a participatory activity to experience the impacts of climate change, to understand the value of forecasts and to enhance the understanding of climate smart disaster risk reduction.
- There are almost 30 climate games applicable for small to large groups (n=6-100) and that cover a range of topics including climate change adaptation and mitigation, collaboration, disaster risk reduction, health, resilience, etc. Each game includes learning objectives, intended audiences, required materials, and pdf and video tutorials. A number of the games specifically connect to forecasting and decision making incuding the Decisions for Seasons game we played during the call. Two other examples include
- Pablo used the GoodGames platform during our call for the Rant and Decisions for the Season activities. The Decisions for the Season can be played in person with the instructions linked on the Climate Centre’s website, but GoodGames has also made an online version here. You can learn more about GoodGames here: https://gg.goodfocus.net/about/. The games do cost money, but if this was something you or your organization were interested in, it would be worth checking in with GoodGames. I believe their are discounts for those in non-profits.
- Pablo shared a 2016 paper he is a co-author on, “Using a Game to Engage Stakeholders in Extreme Event Attribution Science“. You can find his other publications about climate games here.
Going Virtual! What we learned from the EFI-RCN Virtual Workshop
Date: May 21, 2020
Post by: Jody Peters1 and Quinn Thomas2
1 University of Notre Dame, 2Virginia Tech
On May 12 and 13 our NSF-funded EFI Research Coordination Network (RCN) hosted a virtual workshop, “Ecological Forecasting Initiative 2020: Coordinating the NEON-enabled forecasting challenge”. This workshop replaced the three day in-person workshop that was scheduled at the same time, but which was canceled due to COVID-19. Going virtual allowed us to increase our participation and diversity. We were originally space-limited to 65 in-person participants, but with our virtual meeting, we had a little over 200 people register to access the workshop materials, with 150 individuals consistently joining on Day 1 and 110 individuals who consistently participated on Day 2. We also welcomed participants from around the globe with almost 10% of participants calling in from outside the U.S. And instead of being limited to 15 graduate student participants, we ended up with over 50 graduate students who participated in the meeting. While EFI has been using Zoom from the beginning and the EFI-RCN leadership committee members are constantly on Zoom for calls and online courses, this was a much larger gathering than any of us had organized previously. To help others as their workshops are embracing the virtual format, we reflected on the key elements that allowed the workshop logistics and technology flow smoothly. We hope you find our tips useful! If you have any additional questions feel free to reach out to us at eco4cast.initiative@gmail.com.
Prepping for the Meeting
- Get input from many perspectives. There are a number of great suggestions online about hosting virtual workshops. To prepare for the virtual format, multiple leadership committee members took a free 1 hr class on running virtual scientific meetings. You can find the video and slides from the class here https://knowinnovation.com/2020/03/you-too-can-go-virtual/. Alycia Crall from NEON was hugely helpful with ideas like QUBES and Poll Everywhere. Lauren Swanson from Poll Everywhere provided a tutorial on how to use the different features of Poll Everywhere and helped us to test the polls before the workshop. Julie Vecchio, from the Navari Family Center for Digital Scholarship for the Hesburgh Libraries at the University of Notre Dame, shared an example slide deck and script for sharing virtual logistics at the beginning of a workshop. And Google was a great resource for finding additional input along the way.
- Scale your goals to the format and your objectives. Our goal for the original in-person meeting was to finalize rules for the NEON Forecasting Challenge but we knew that this was not possible virtually. However, the virtual meeting allowed us to have more people and more perspectives for idea generation. Therefore, our goals shifted to brainstorming so that we could leverage perspectives from the diverse attendees. We now have a ton of work to do synthesizing the input but we have a better pulse of what the community is interested in. Recognizing the challenge of engaging attendees virtually over long periods of time, we reduced the original 3-day in person meeting to a 2-day meeting with a schedule that was conducive to participants from east to west coasts of the U.S.
- Virtual meetings require as much or more prep than in-person meetings. Be prepared for a lot of planning before the meeting.
General Meeting Set-up
- Don’t go all day. Our first day was 6 hours and the second day was only 4 hours and the hours were set to accommodate people from the U.S. east and west coast time zones. Unfortunately, there is no good time for all global participants, but we were thrilled to see so many participants who woke up early or stayed up late to join us from outside the U.S.
- Incorporate plenty of breaks. Virtual meetings are more tiring than in-person meetings. We had two longer 30-minute breaks that corresponded to lunch-times on the U.S. east and west coasts as well as shorter 15-minute breaks spread throughout both days.
- Have a production manager for the meeting. This person focuses on set up and running the technical logistics. For example, this person stays in the main room during breakouts to provide assistance and oversee the timing of activities. Having a production manager allows the meeting lead (i.e., project Principal Investigator) to be the M.C. of the meeting and do real time synthesis of the ideas without having to worry about meeting logistics.
- Create a minute-by-minute script for the entire meeting. This includes both the public Agenda and the behind the scenes tasks. For example, we wrote out the messages that would be sent through Zoom Chat/Breakout messaging with the time that each message would be sent. You should be able to articulate in writing what is going to happen at every moment of the meeting before the meeting starts and assign who is going to do each task.
- Pre-record talks and add edited closed captioning. This prevents issues that come with live talks like bad mics or bad connections. This also keeps the meeting on schedule and avoids the awkward need to cut someone off. We felt the talks were better because they were pre-recorded and, for the talks that presenters agreed to share, we now have an excellent resource for folks that missed the meeting. The pre-recorded talks may require editing, so find someone with resources and time to make edits prior to the meeting. We made playlists for each plenary session available as unlisted videos on YouTube for any workshop participant that had connection issues while the videos were being played.
- Be prepared to pay for a closed captioning service so that the meeting is accessible. In the registration form for the meeting, ask if anyone needs CC and if they do, hire a service. We were able to find a service through our university (Virginia Tech) vendor system that worked well (www.ACSCaptions.com). The production manager moved the captioner to be in the same Breakout as those that requested the service. CC is also nice, because you get the full record of text right after the meeting, instead of waiting for the Zoom transcript to come through, plus the captioner’s transcription is better than the automatic Zoom transcript.
- Use hardwired internet. Our production manager/meeting host used a computer that was connected to the internet via a wire – this will reduce the chance that the central person loses connection.
- Plan for leadership team meetings during the workshop. The leadership committee met for 1 hour before and 30 minutes after the meeting each day to go over last minute logistics and any adjustments that were needed. Set up a separate Zoom meeting for these calls to avoid participants joining at times when you are not prepared for them.

- Zoom worked great. While we know that there are other conferencing platforms, we used Zoom Meeting with a 300 person limit, hosted through the University of Notre Dame. We chose Zoom Meeting over Zoom Webinar, because we wanted the ability for workshop participants to interact during breakouts. Plus it was provided by the University, and did not require the additional set-up or payment that Zoom Webinar required. It worked very well. There were some individuals that could not access Zoom. Therefore, we also streamed the workshop from Zoom to YouTube and shared the YouTube live link with individuals in our group who had registered for the workshop materials.
- But Zoom can break communication lines among the host and leadership committee. Have an off Zoom and off computer way for the leadership team to communicate throughout the meeting (like text messaging to phones). It is important to turn off notifications on the host/co-hosts computer due to screen sharing and sounds, but that can leave the production manager or leadership team flying blind unless there is an alternative way to communicate. Leadership committee members that are in Breakout Rooms are unable to message the host in Zoom.
- Assign leadership committee members as co-hosts. Assign all leadership members as co-hosts and have them mute people who are not talking but have background sounds. Leadership members can also help with spotlighting the speakers and can also move from breakout room to breakout room if needed to check on how things are going.
- Give a brief Zoom training at the beginning. At the beginning of the workshop, use a slide deck (and a written out script to go with it) to introduce all the features of Zoom you want people to use. While many of us use Zoom regularly, not everyone is on Zoom all the time, and it is important that these folks feel comfortable so they can fully participate.
- Play videos directly from the production manager/meeting host’s computer. Make sure the videos are downloaded onto your computer hard drive and play them from there. We used a playlist that automatically advances to the next video. In Zoom’s screen share settings, make sure to click both the “Share computer sound” and “Optimize Screen Sharing for Video Clip” options. Do not play videos in Zoom from YouTube to avoid the video having to be played over multiple web services.
Zoom Breakout Rooms
- Keep Breakout Rooms small. To make the meeting feel smaller we only had a max of 9 people per breakout room. Using random sorting, as we did on Day 1, was a great way to meet different people throughout the group. We built in time for introductions during the breakouts because one of our goals was community building
- Clear and easy to find Breakout instructions. Have specific and easy to find instructions for each Breakout session. If possible try to spread the leadership team among different Breakout Rooms. In practice, this is hard because the production manager has to find them in the list of random Breakout Rooms and reassign (but see point 4 below and have the leadership members rename themselves). In reality, specific instructions that aren’t too complex will allow Breakout Rooms to work fine without a member of the leadership team. Our instructions were located in an easy to find place on the meeting website.
- Prepare for providing assistance getting into Breakout Rooms. Some people may not see their notification to join a Breakout Room pop up, so the production manager may need to walk them through that. Include a screenshot in the introductory Zoom instructions of what the Breakout Room assignment notification looks like so people know where to look.
- Give extra time if using manually assigned (non-random) Breakout Rooms. Manually sorting Breakout Rooms takes longer to organize so be sure to include the sorting time in your plans. The assigning and sorting can be done at any time during the plenary, it does not need to happen right before the Breakout Rooms open. Use the renaming feature of Zoom to ease the sorting. If everyone changes their Zoom name (under the Participants tab) to start with their group name or number (e.g., A1 Jody) it is much much easier for the production manager to sort.
- Create extra Breakout Rooms. When setting up the manually sorted Breakout Rooms, create additional rooms that may stay empty. There may be groups that want to breakout further and if you did not create an extra room when you set up the manually sorted rooms, these additional rooms cannot be added after the rooms are opened.
- Character limits for messages to Breakout Rooms. There is a character limit for the messages that can be sent to the Breakout Rooms, so keep them short.
- Breakout Rooms are unable to communicate with the production manager. When individuals are in the Breakout Rooms, they cannot use the Zoom Chat to communicate with the production manager in the main room or anyone else in the workshop who is in another Breakout Room. This is important to mention in the introductory Zoom instructions.

Communication throughout the Workshop: Poll Everywhere and QUBES
- Create a means for engagement. It is important for attendees to feel like they are involved so that the workshop isn’t a one-way delivery of information. We used an educational account of Poll Everywhere through the University of Notre Dame to help promote participation throughout the workshop in multiple ways, including brainstorming ideas with word clouds, submitting questions and voting on priority questions for panel members, and brainstormed priorities that also could be voted on.
- Define use of communication tools. Use the Zoom Chat for logistics and supplemental information and Poll Everywhere for Q&A. That way questions on science do not get lost in questions about links or timing etc. We also were able to download all the questions for the panelists to get their feedback on any questions that we did not have time for during the Q&A sessions. We will share this feedback with the workshop participants in the next month.
- Centralize meeting materials. We used QUBES as a platform to organize and share materials easily in a centralized location. The EFI-RCN QUBES site worked well because it was free (thanks NSF and Hewlett Foundation), easy to set up, and we were able to include links to videos, surveys, Zoom login, google documents, papers, etc. all in one place.
EFI at AGU 2019
Date: December 6, 2019
EFI’s oral and poster sessions on “Ecological Forecasting in the Earth System” have been scheduled for Wednesday, December 11, 2019 from 4-6pm in Moscone 3001 (oral session) and on Wednesday morning from 8am-12:20pm(posters). We’re excited to have a great set of speakers that really span the full gradient from terrestrial to freshwater to marine. Come check out the following talks!
Wednesday EFI Oral Session (4-6pm, Moscone 3001)
16:00 Nicole Lovenduski – High predictability of terrestrial carbon fluxes from an initialized decadal prediction system
16:15 Ben Bond-Lamberty – Linking field, model, and remote sensing methods to understand when tree mortality breaks the forest carbon cycle
16:30 Zoey Werbin – Forecasting the Soil Microbiome
16:45 Brian Enquist – Forecasting future global biodiversity: Predicting current and future global plant distributions, community structure, and ecosystem function
17:00 Heather Welch – Managing the ocean in real-time: Ecological forecasts for dynamic management
17:15 Clarissa Anderson – Bringing new life to harmful algal bloom prediction after crossing the valley of death
17:30 Ryan McClure – Successful real-time prediction of methane ebullition rates in a eutrophic reservoir using temperature via iterative near-term forecasts
17:45 Carl Boettiger – Theoretical Limits to Forecasting in Ecological Systems (And What to Do About It)
Wednesday EFI Poster Session (8am-12:20pm, Moscone South Poster Hall)
Christopher Trisos – B31J-2509 The Projected Timing of Abrupt Ecological Disruption from Climate Change
Gleyce K. D. Araujo Figueiredo – B31J-2510 Spatial and temporal relationship between aboveground biomass and the enhanced vegetation index for a mixed pasture in a Brazilian integrated crop livestock system
Rafael Vasconcelos Valadares B31J-2511 Modeling Brazilian Integrated Crop-Livestock Systems
Zhao Qian – B31J-2512 An optimal projection of the changes in global leaf area index in the 21st century
Takeshi Ise – B31J-2513 Causal relationships in mesoscale teleconnections between land and sea: a study with satellite data
Hisashi Sato – B31J-2514 Reconstructing and predicting global potential natural vegetation with a deep neural network model
Masanori Onishi – B31J-2515 The combination of UAVs and deep neural networks has a potential as a new framework of vegetation monitoring
Yurika Oba – B31J-2516 VARENN: Graphical representation of spatiotemporal data and application to climate studies
Stephan Pietsch – B31J-2517 A Fast and Easy to use Method to Forecast the Risks of Loss of Ecosystem Stability: The Epsilon Section of Correlation Sums
Jake F Weltzin – B31J-2518 Developing capacity for applied ecological forecasting across the federal research and natural resource management community
Theresa M Crimmins – B31J-2519 What have we learned from two seasons of forecasting phenology? The USA National Phenology Network’s experience operationalizing Pheno Forecasts
Tim Sheehan – B31J-2520 Sharp Turn Ahead: Modeling the Risk of Sudden Forest Change in the Western Conterminous United States
Margaret Evans – B31J-2521 Continental-scale Projection of Future Douglas-fir Growth from Tree Rings: Testing the Limits of Space-for-Time Substitution
Ann Raiho – B31J-2522 Improving forecasting of biome shifts with data assimilation of paleoecological data
Quinn Thomas – B31J-2523 Near-term iterative forecasting of water quality in a reservoir reveals relative forecastability of physical, chemical, and biological dynamics
Alexey N Shiklomanov – B31J-2524 Structural and parameter uncertainty in centennial-scale simulations of community succession in Upper Midwest temperate forests
Peter Kalmus – B31J-2525 Identifying coral refugia from observationally weighted climate model ensembles
Jessica L O’Connell – B31J-2526 Spatiotemporal variation in site-wide Spartina alterniflora belowground biomass may provide an early warning of tidal marsh vulnerability to sea level rise
Rafael J. P. Schmitt – B31J-2527 Assessing existing and future dam impacts on the connectivity of freshwater fish ranges worldwide
Teng Keng Vang – B31J-2528 Site characteristics of beaver dams in southwest Ohio
Other Forecasting Presentations
Mon 13:40-15:40, Moscone South e-Lightning Theater: Alexandria Hounshell, ED13B-07 Macrosystems EDDIE: Using hands-on teaching modules to build computational literacy and water resources concepts in undergraduate curricula (Alex’s presentation will be at ~2pm)
Mon 13:40-18:00, Poster Hall: Hamze Dokoohaki B13F-2442 – A model–data fusion approach to estimating terrestrial carbon budgets across the contiguous U.S
Mon 14:25, Moscone 3005: Michael Dietze B13A-04 – Near real-time forecasting of terrestrial carbon and water pools and fluxes
Mon 17:40, Moscone 3003: Michael Dietze B14B-11 Near real-time forecasting in the biogeosciences: toward a more predictive and societally-relevant science
Tues 13:40-18:00, Poster Hall: Erin Conlisk B23F-2598 – Forecasting Wetland Habitat to Support Multi-Species Management Decisions in the Central Valley of California
Wed 08:00-12:20, Poster Hall: B31H Building Resilient Agricultural Systems Supported by Near-Term Climate and Yield Forecasts II [Poster Session]
Wed 13:55, Moscone 3005: Inez Fung B33A-02 – Towards verifying national CO2 emissions
Thurs 09:15, Moscone 3012: John Reager B41A-06 – Hydrological predictors of fire danger: using satellite observations for monthly to seasonal forecasting
Fri 10:20-12:20, Moscone 3007: B52A Building Resilient Agricultural Systems Supported by Near-Term Climate and Yield Forecasts I [Oral Session]
EFI Social
Anyone who is available to meet up after the Forecasting Session on Wednesday, we’ll have a group getting together at Tempest starting around 6:30 pm. It’s an 8 minute walk. Find directions here.
Seeking Judges for Outstanding Student Presentations
We would like to recruit judges for the student presentations in our forecasting sessions at AGU this year. We have one candidate for Outstanding Student Presentation in our poster session on Wednesday morning (B31J) and two candidates in our oral session Wednesday afternoon (B34C). If you plan to attend either of these sessions, please consider helping to mentor a young researcher with some constructive feedback.
You can sign up to judge at https://ospa.agu.org/2019/ospa/judges/ to register and agree to the honor code by selecting “Register to Judge”.Once there, sign up for the student presentations you wish to evaluate. Every judge must sign up for at least three presentations to ensure that all students are provided with feedback. Select “Find Presentations”. You can search for presentations by B31J or B34C in the lower of the two “quick search” boxes.When you arrive for Fall Meeting, confirm the time and location of the presentations you are evaluating. You can sync your judging schedule to your personal calendar to ensure you don’t accidentally miss any presentations. Go to your OSPA schedule and click ‘Add to Calendar’ on the task bar. Your judging schedule will now be added to your Google Calendar, Outlook, or iCalendar.You will need to evaluate all presentations you volunteered to judge. Students depend on your feedback to assess their presentation skills, identify the areas in which they are performing well, and areas that need improvement.Either submit scores in real time on a tablet or mobile device or take notes while you evaluate students and enter the scores later. Do not rely on your memory alone to submit complete scores at a later time. Students participate in OSPA to improve their presentation skills, so please provide them with thorough feedback. This year, comments are required in addition to the numerical scores. All reviews must be entered into the OSPA site no later than Friday, 20 December 2019, at 11:59 p.m. EDT.Finally, be constructive! OSPA presenters range in education levels from undergraduate to Ph.D. students. There are also many presenters for whom English is not their first language. Keep these things in mind when providing feedback. Judges are asked to evaluate students at their current education and language proficiency levels.
Predicting Nature to improve environmental management: How close are we and how do we get there?
Original Date: October 17, 2019; Updated: October 22, 2019
Melissa Kenney from the University of Minnesota presented in the John Wesley Powell Center for Analysis and Synthesis 2019 Seminar Series.
A recording of Melissa’s presentation can be found here: https://my.usgs.gov/confluence/display/PowellCenterAdmin/Powell+Center+Seminar+Series+2019

2019 Seminar Series
All seminars are presented online at: zoom.us/j/663855534
Predicting Nature to improve environmental management: How close are we and how do we get there?
When: Monday, October 21st, 11am MT/1pm ET
Presented by: Melissa Kenney – University of Minnesota

Dr. Melissa A. Kenney is an environmental decision scientist with expertise in multidisciplinary, team-based science approaches to solving sustainability challenges. Her research program broadly addresses how to integrate both scientific knowledge and societal values into policy decision-making under uncertainty. Dr. Kenney is also the Associate Director of Knowledge Initiatives at the University of Minnesota’s Institue on the Environment where she directs efforts to build synergy across IonE’s broad scientific research portfolio. She earned a Ph.D. from Duke University, focused on integrating water quality and decision models.
Powell Center Working Group: Operationalizing Ecological Forecasts
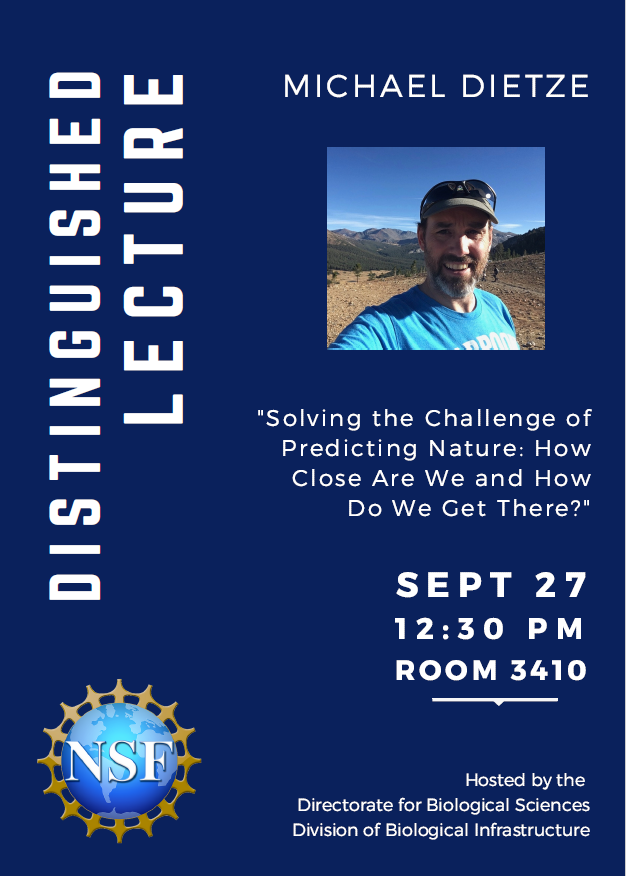
NSF Distinguished Lecture: Dietze on September 27, 2018
Date: September 19, 2018
If anyone would like to attend this lecture, they should email Tara Bracken to get on the visitor list!