
January 17, 2024
Fullscreen ModeEFI Newsletter Issue 37
EFI at AGU 2023
December 1, 2023
Below is the list of poster and oral presentations for EFI’s hosted session at the American Geophysical Union (AGU) 2022 Conference in Chicago, as well as other ecological forecasting-related talks that may be of interest to the community. All times are listed in US Pacific Time.
EFI has name badges! EFI community members can find Mike Dietze at the Conference, during the EFI-hosted sessions, or at the Social to get a badge.

Tuesday EFI Social – Anyone who is available to meet up on December 12, Tuesday evening, we’ll have a group getting together from 7:00-9:00pm at 1015 Howard St, which is just an 11-minute walk from the Moscone Center.
Tuesday Poster and Oral Sessions – EFI’s oral and poster sessions on “Ecological Forecasting in the Earth System” will be held on Tuesday, December 12. The Poster Session is from 8:30am-12:50pm in Poster Hall A-C – South (Exhibition Level, South, MC). The Oral session is from 14:10-15:40pm in 3008 – West (Level 3, West, MC). We’re excited to have a great set of speakers that really span the full gradient from terrestrial to freshwater to marine. Come check out the following talks!
Tuesday Poster Session (9:00-12:30, Poster Hall A-C- South)
- Tierney Cantwell (Gettysburg College) – Sudden Oak Death and its Forecasted Threat to California Oaks using Maximum Entropy Modeling
- Joshua Ploshay (California State University Monterey Bay) – Spatiotemporal Patterns of Carbon (C) Cycle Variability Across North America: A Machine Learning Downscaling of a Process-based C Reanalysis Product
- Rob Kooper (University of Illinois at Urbana Champaign) – Unlocking the Power of ED2 Model on HPC Clusters: A Singularity Container Approach
- Qianyu Li (Brookhaven National Laboratory) – Assimilation of Satellite Observations Improves Seasonal Model Forecast of Leaf Area Index Over CONUS NEON Sites
- Matthew Petrie (University of Nevada Las Vegas) – Elucidating aridification pathways across the ecosystems of a semiarid elevational gradient
- Priyanka Singh (University of Petroleum and Energy Studies) – Machine Learning to Assess Large-scale Mining Impacts on Biodiversity Health
- Preethi Balaji (NASA DEVELOP) – Forecasting the Ecological Impacts of Targeted Cattle Grazing as a Management Tool to Improve Wetland Habitat in Southeastern Idaho
- Stephen E MacAvoy (American University) – Metabolic Plasticity, Measured by Stable Isotope Turnover, as a Proxy for Resilience to Warming Temperatures in the Seep Amphipod Gammarus minus and Isopod Caecidotea kenki
- Jiahao Zhang (Tsinghua University) – The origin of Risk of Golden Mussel (Limnoperna fortunei) Invasion
- Mark B Hausner (Desert Research Institute Reno) – Historical and Projected Drivers of Population Dynamics of the Endangered Devils Hole Pupfish (Cyprinodon diaboils)
Tuesday Oral Session (14:10-15:40, 3008 – West (Level 3, West, MC)
- 14:10 – Gerbrand Koren (Utrecht University) – Forecasting terrestrial carbon exchange over North America from sub-daily to multi-annual time scales
- 14:20 – Malcolm Itter (University of Massachusetts Amherst) – Making More With Continuous Forest Inventory Data: Toward a Scalable, Dynamical Model of Forest Change
- 14:30 – Alyssa Willson (University of Notre Dame) – Biotic interactions moderate the climate-vegetation relationship over the last 2,000 years of the pre-Industrial Holocene in the Upper Midwest, U.S.
- 14:40 – Morteza Karimzadeh (University of Colorado Boulder) – Forecasting Post-Fire Vegetation Recovery Using Deep Learning
- 14:50 – Dongchen Zhang (Boston University) – Terrestrial Carbon Pool Reanalysis Using State Data Assimilation Over CONUS NEON Sites
- 15:00 – Freya Olsson (Virginia Tech) – Power of multiple models in lake forecasting
- 15:10 – Dante Horemans (Virginia Institute of Marine Science, William & Mary) – Real-time Forecasts of Harmful Algal Blooms using Empirical Habitat Suitability Models
- 15:20 – Joshua Grail (ESRI) – Predicting Snow Crab Habitat Across Climate Scenarios Using Maximum Entropy Modelling
- 15:30 – Discussion
Other Forecasting Presentations
If you are presenting an ecological forecasting-related talk or poster that you don’t see on the list, reach out so we can get it added!
- Mon: 9:52-10:00, Anne Heggli, 2010 – West (Level 2, West, MC) – The Use of Hourly SNOTEL Data to Produce Snowpack Runoff Decision Support for Midwinter Rain-on-Snow
- Mon: 10:22-10:32, Isabella Kazen, 2007 – West (Level 2, West, MC) – Characterizing Parameter Uncertainty in Ecological Forecasts across Different Plant Functional Types
- Mon: 10:30-10:40, Michael Dietze, 2006 – West (Level 2, West, MC) – Landscape-scale iterative monitoring and forecasting of terrestrial carbon pools and fluxes: a Harvard Forest testbed
- Mon: 12:40-12:50, Ana M Tarano, 3009 – West (Level 3, West, MC) – Evaluating Global Benthic Habitat Maps Derived from Machine Learning: NASA’s Neural Multimodal Observation and Training Network
- Wed: 8:30-12:50, Yi Hong, Poster Hall A-C – South (Exhibition Level, South, MC) – Challenges and Opportunities for the Next Generation Water Resources Modeling Over the Laurentian Great Lakes Region
- Wed: 14:10-18:30, Xin Huang, Poster Hall A-C – South (Exhibition Level, South, MC) – Iterative forcing correction improves forecasts of carbon pool dynamics more than fluxes
- Wed: 14:10-18:30, Russell Limber, Poster Hall A-C – South (Exhibition Level, South, MC) – Forecasting River Ice Breakup in Alaska USA Using a Long Short Term Memory Model
- Thurs: 14:10-18:30, Enoch Bessah, Poster Hall A-C – South – Verification of Indigenous Weather and Seasonal Climate Forecast skills for Climate Change Adaptation in the Pra River Basin of Ghana
- Thurs: 15:50-16:15, Patrick J Clemins, 160 – South (Upper Mezzanine, South, MC) – Northeast Evaluation Testbeds for Hydrologic Impacts Forecasting
- Fri: 14:10-18:30, Pierre C Guillevic, Poster Hall A-C – South – Evaluation of Planet’s Biomass Proxy – a Combination of Optical and SAR Earth Observations – to Monitor Crop Conditions and Forecast Yield
EFI Book Club Suggestions & Actions Items
November 27, 2023
The following document was created by the DEI Working Group in October 2023 in response to the final discussion of the group that participated in the book club which read “97 Things About Ethics Everyone in Data Science Should Know”.
Goals of this document:
- Provide a summary of action items suggested during book clubs. The summary is a living document kept on the EFI Book Club webpage and action items will be added from future book clubs. This document is to be used as a reference to support and inspire activities for EFI that can be developed/led as individuals have time, availability, and interest in doing so
- Provide an opportunity to collate and celebrate activities that have taken place and those activities that will take place in the future that have been inspired by or align with suggestions from the book clubs.
Books Read
- 97 Things About Ethics Everyone in Data Science Should Know
- Weapons of Math Destruction
- Braiding Sweetgrass
- Caste: The Origins of Our Discontents
- The Years That Matter Most: How College Makes or Breaks Us
Note: There was a group within EFI that read Spatio-Temporal Statistics with R. That book group was not led by the DEI working group and was not included in this assessment.
Have we done any of the stuff we planned to do?
- From 97 Things About Ethics
- Summarize ideas we’ve had in previous book clubs and do self-assessment
- This document!
- Summarize ideas we’ve had in previous book clubs and do self-assessment
- From Braiding Sweetgrass
- Gratitude statement regarding data as a gift from the community, posted in:
- Newsletter
- Book club page
- The book club included student participants from the Sustainable Land and Water Resources (SLAWR) REU which provided opportunities for discussions across career stages and sectors
- Gratitude statement regarding data as a gift from the community, posted in:
- From Weapons of Math Destruction
- JEDI (justice, equity, diversity, inclusion) database assessing who is in EFI is a good place to start to contribute to the self-assessment
- Dave Klinges (University of Florida) has worked with EFI Community Manager, Jody Peters (University of Notre Dame) to develop a workflow to assess the demographics of EFI members and how that changes through time
- JEDI (justice, equity, diversity, inclusion) database assessing who is in EFI is a good place to start to contribute to the self-assessment
- From The Years That Matter Most and from Caste
- DEI Workshop ideas – webinar series leading up to workshops. Whose voices do we want to hear ahead of time
- Culturally competent training
- In late 2020/early 2021 the EFI DEI working group hosted 4 panels for the “Conversations on Diversity and Data Seminar Series.” See the links below for the recordings for each panel and the resources shared.
- What do diverse students need to thrive in data- and computer-heavy settings? November 19, 2020
- What does culturally competent data science training look like? January 20, 2021
- How can 4-year data-driven institutions and programs support students transferring from community colleges? February 19, 2021
- What kind of online tools are useful and work well for remote learning and teaching? March 25, 2021
- From Caste:
- Mentorship networks and having a series of mentors
- EFISA co-working session
- Developing a mentoring network for minority students is one of the goals of the Alfred P. Sloan Foundation Equitable Pathways funding from the project “A Generation of Native American Earth and Environmental Data Scientists” that EFI is involved with
- Still working on developing this, but the idea is for BIPOC students in research to have mentors from their own institution as well as mentors from the institutions they are doing research with and that the mentors will continue to support the students beyond the original activity
- Mentorship networks and having a series of mentors
- From the Years That Matter Most
- Train the trainers
- This is something that continues to be included in EFI-led proposals. Freya Olsson is also thinking about updating her NEON Forecasting Challenge workshop material which is currently geared towards participants wanting to learn how to submit forecasts to the Challenge to be applicable for people want to teach others how to submit to the Forecasting Challenge
- On the October 2023 Education working group call, the group discussed the following two papers. The first is about the needs for instructor training for people teaching data science at the collegiate level. The second provides papers, discussion prompts, and R code materials that can be used or modified for teaching ecological forecasting at the upper undergrad/early grad student level
- Highlight the #jobs and #funding Slack channels in the newsletter and in the welcome letter for new EFI members.
- Train the trainers
Do any of the ideas overlap between books?
- The Years That Matter Most, Caste, and 97 Things: mentorship, supporting involvement, inclusive trainings
- Ongoing EFI efforts with potential overlap:
- EFISA efforts to share grant applications
- Ongoing EFI efforts with potential overlap:
- Braiding Sweetgrass, Weapons of Math Destruction, and 97 Things: addressing unintended consequences of forecasts and taking time for self reflection
- Ongoing EFI efforts with potential overlap:
- Examining EFI efforts from the lens of Design Justice Principles
- Social scientist-ecologist matchmaking
- Ongoing EFI efforts with potential overlap:
A full list of the notes and recommendations compiled from the book clubs can be found in the living document on the EFI Book Club webpage.
EFI Newsletter Issue 36
Congratulations to Jacob Zwart on the 2023 ESA Ecological Forecasting Award!
The ESA Statistical Ecology section presented the 2023 Ecological Forecasting Outstanding Publication Award to Jacob Zwart and collaborators for their 2022 Journal of the American Water Resources Association paper:
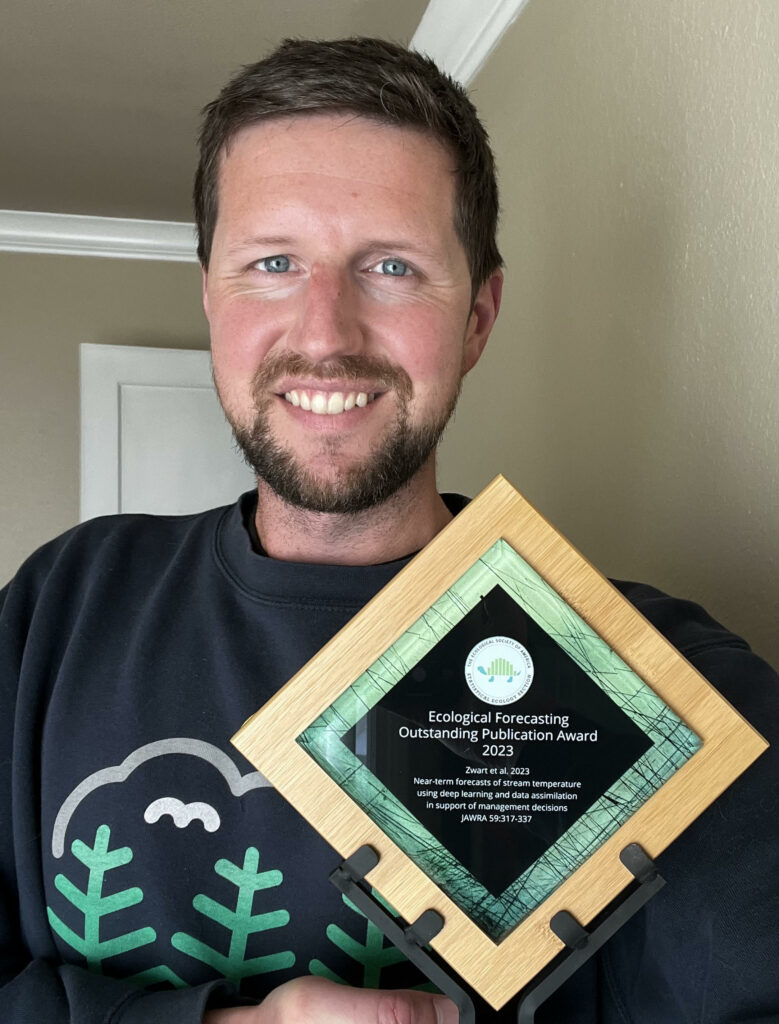
The award committee was impressed by the novel methodological contributions of the paper, in fusing machine learning with traditional data assimilation approaches. The committee also values the authors’ ability to put this forecast into operations, to tie a novel forecasting approach to actionable real-world decisions, and the overall readability and approachability of what is otherwise a very technical paper.
Nominate Papers for the 2024 Award
Individuals wishing to nominate papers published in the past 3 years for the 2024 award are encouraged to do so by the March 1, 2024 deadline. Additional information can be found at https://www.esa.org/stats/awards/ecological-forecasting-outstanding-publication-award/
Full List of Award Winners & Citations
2023 – Jacob Zwart (USGS)
Zwart, J.A., Oliver, S.K., Watkins, W.D., Sadler, J.M., Appling, A.P., Corson-Dosch, H.R., Jia, X., Kumar, V., and Read, J.S. 2023. “Near-Term Forecasts of Stream Temperature Using Deep Learning and Data Assimilation in Support of Management Decisions.” JAWRA Journal of the American Water Resources Association 59 (2): 317–37. https://doi.org/10.1111/1752-1688.13093.
2022 – Kelly Heilman (University of Arizona)
Heilman, K.A., Dietze, M.C., Arizpe, A.A., Aragon, J., Gray, A., Shaw, J.D., Finley, A.O., Klesse, S., DeRose, R.J., & Evans, M.E.K. (2022). Ecological forecasting of tree growth: Regional fusion of tree-ring and forest inventory data to quantify drivers and characterize uncertainty. Global Change Biology 28(7):2442-2460 doi.org/10.1111/gcb.16038
2021 – Sarah Saunders (National Audubon Society)
Saunders, S.P., F.J. Cuthbert, and E.F. Zipkin. “Evaluating Population Viability and Efficacy of Conservation Management Using Integrated Population Models.” Journal of Applied Ecology 55, no. 3 (2018): 1380–92. https://doi.org/10.1111/1365-2664.13080.
2020 – Paige Howell (USGS)
Howell, P.E., B.R. Hossack, E. Muths, B.H. Sigafus, A. Chenevert‐Steffler, and R.B. Chandler. “A Statistical Forecasting Approach to Metapopulation Viability Analysis.” Ecological Applications 30, no. 2 (2020): e02038. https://doi.org/10.1002/eap.2038.
2019 – Maria Paniw (CREAF, Ecological and Forestry Applications Research Centre)
Paniw, M., N. Maag, G. Cozzi, T. Clutton-Brock, and A. Ozgul. “Life History Responses of Meerkats to Seasonal Changes in Extreme Environments.” Science 363, no. 6427 (February 8, 2019): 631–35. https://doi.org/10.1126/science.aau5905.
2018 – Quinn Thomas (Virginia Tech)
Thomas, R.Q., E.B. Brooks, A.L. Jersild, E.J. Ward, R.H. Wynne, T.J. Albaugh, H. Dinon-Aldridge, et al. “Leveraging 35 Years of Pinus Taeda Research in the Southeastern US to Constrain Forest Carbon Cycle Predictions: Regional Data Assimilation Using Ecosystem Experiments.” Biogeosciences 14, no. 14 (2017): 3525–47. https://doi.org/10.5194/bg-14-3525-2017.
EFI Newsletter Issue 35
Transporting Models Between NEON and non-NEON Systems
September 5, 2023
Brendan Allison1, Olufemi Fatunsin2, Jeffrey Mintz3
1University of Texas, Austin, 2University of Alabama, 3University of Florida
AS NSF NEON data becomes more prominent in forecasting and other forms of ecological modeling, these models may potentially become products in themselves, distilling some important characteristic of this continental-scale network. A natural follow-up question as we seek to use not only the raw data but these derived products is that of model transportability. In this project group started at the 2023 Unconference, we asked:
1) How can we take models trained on NEON data and refine them for use in another context?
2) How can we take models trained on non-NEON data and refine them on NEON data?
Doing this effectively can empower a range of applications, including local field studies, adaptive management, and data fusion from multiple monitoring networks, enabling greater statistical power for big ecological questions. We realized that, whether transporting a model to or from NEON, the vast majority of challenges are the same. These included unbalanced data, different monitoring protocols, different predictors, and different site selection criteria. As anyone who has fused multiple datasets together can tell you, even ostensibly identical data products can differ in both subtle and dramatic ways. Naturally, models trained on one data product will inherit the distinct characteristics of the monitoring networks they are derived from. There is nevertheless remarkable potential in being able to leverage what are in many cases continental-scale models for anything from fusion with another continental-scale network to an informed prior for a small-scale field study, dramatically increasing statistical power.
In framing the problem, we found it helpful to consider similarities with longstanding efforts to effectively downscale global climate models to local forecasts. Here, the two main classes of approach are dynamic (re-running a tuned version of the full model with nested local components, ensuring that known physics are respected) and statistical (examining correlations between global climate model outputs and local history, with the benefit of much faster performance). For the greatest flexibility, including compatibility with black-box machine learning approaches with unknown dynamics, we took inspiration from the statistical approaches.
Our only hard requirement as input for the modeling process was thus an existing model that can make predictions for an arbitrary set of sites, given a set of predictor covariates for these sites, alongside the ability to measure the true value of the predicted variable at these sites. From here, we can subtract prediction from true value, generating a dataset of residual errors. This sort of additive bias correction is not the only approach to the problem, but it is simple and effective. Any skill in predicting these errors represents an improved model: simply take the sum of the original model and the bias correction term to make new forecasts. At the same time, one may examine the various machinery of the residual error model alone to learn something about the gaps and biases in the original model. Allowing models to be incrementally improved in this fashion will enable teams to improve on existing models by tailoring them to their particular ecosystem of interest and the data they have at hand.
Case Study
To focus our efforts, we picked the particular case study of bringing together NEON forest data with similar datasets generated under the Forest Inventory Analysis (FIA) program. Because FIA has multiple hundreds of thousands of plots measured across decades of operation, while the more recent NEON network offers more intensive monitoring within a smaller set of sites, both networks have the potential to bolster one another. Our basic setup was to train a model predicting forest productivity at FIA sites from a small set of environmental covariates. Though we would train this ourselves, we would not take advantage of our knowledge of its structure or details. Instead, it serves as a stand-in for any existing black box model, which in some sense represents the distillation of a large body of FIA data. Typically, it would be a model generated by some other research group or forecasting team, which we seek to leverage in our own work. Using predictions from this FIA-trained model, we calculate a set of error residuals at both NEON and FIA sites, and ask: can we leverage this for a more robust multi-system model?
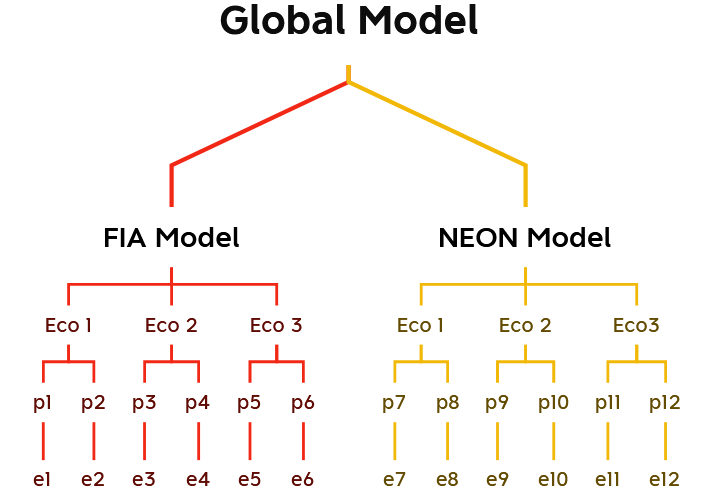
Our first product was the development of a draft Bayesian multilevel model that would be equally capable of integrating multiple sets of continental or global-scale monitoring networks as it would be of making predictions at a single site of interest, but informed by some larger statistical structure. We show our first/guiding version of this in the figure below; it changed a little over development, but the basic idea remained. Hierarchical structures such as this are commonly described as partial pooling approaches. This is because FIA and NEON systems are not assumed to operate under the same model. Nor are they assumed to be fully independent. Instead, they will flexibly share a set of data-driven parameters, in this case through the top layer of a global forestry model, while having the flexibility to stray a little from this global model to account for system-specific differences.
To account for spatial autocorrelation, we briefly considered Gaussian processes, but settled on building ecoregions into the model hierarchy for two main reasons. The first is that geographic distance is different from ecological distance: a mile might take you from prairie to mountaintop in one case, and from prairie to prairie in another case. The second is practical: because Gaussian processes and related kernel methods tend to scale poorly with increasing data, they tend to require extensive approximations for the fusion of multiple continental-scale datasets.
As mentioned, while this was our inspiration, we did make a few changes. The main change was to dial back on the nesting. In the above diagram, ecoregions are nested inside continental-scale monitoring networks, such that Level 3 – Ecoregion 1 – NEON plots are allowed to have different predictive models than Level 3 – Ecoregion 1 – FIA plots. This could be useful and true, but we realized that we were most interested in 1) the global forestry model at the top of the hierarchy, 2) any global differences between the types of sites or measurement protocols of NEON and FIA, and 3) any Level 3 Ecoregion variations in model structure. Thus the minor combinatorial explosion in parameters of nesting ecoregions inside monitoring systems seemed a cost without a corresponding benefit in scientific lessons learned. We decided to bring both ecoregion and monitoring system variables to the same level of the hierarchy.
So far, the model has been tested on synthetic data, with code developed in Stan, using the CmdStanR library in R. Once we’ve had the chance to hone the model against real data, we’ll push all the code to a NEON repository for the community to begin playing around with it. From there, some version of the project is likely to continue and become a more formal manuscript. We may also reintroduce some complexity to the model in the form of nested ecoregions.
With that said, we’d be interested in hearing from other members of the community. How to integrate NEON data with that of other monitoring networks, how to use it to inform local field studies, and how to leverage it for management goals at non-NEON sites are all open and important questions. What potential applications do you see? Are you working on similar projects?
Contact us at info@ecoforecast.org to share your interests in the project or similar work you are doing!
Reenvisioning EFI-RCN NEON Forecast Challenge Dashboard Visualization
August 22, 2023
Melissa Kenney1, Michael Gerst2, Toni Viskari3, Austin Delaney4, Freya Olsson4, Carl Boettiger5, Quinn Thomas4
1University of Minnesota, 2University of Maryland, 3Finnish Meteorological Institute,4Virginia Tech, 5University of California, Berkeley
With the growth of the EFI NEON Ecological Forecasting Challenge, we have outgrown the current Challenge Dashboard, which was designed to accommodate a smaller set of forecasts and synthesis questions. Thus, we have reenvisioned the next stage of the EFI-RCN NEON Forecast Challenge Dashboard in order to facilitate the ability to answer a wider range of questions that forecast challenge users would be interested in exploring.
The main audience for this dashboard are NEON forecasters, EFI, Forecast Synthesizers, and students in classes or teams participating in the Forecast Challenge. Given this audience, we have identified 3 different dashboard elements that will be important to include:
- forecast synthesis overview,
- summary metrics about the Forecast challenge, and
- self diagnostic platform.
During the June 2023 Unconference in Boulder, our team focused on scoping all three dashboard elements and prototyping the forecast synthesis overview. The objective of the synthesis overview visual platform is to support community learning and emergent theory development. Thus, the synthesis visualizations are aimed at creating a low bar entry for multi-model exploration to understand model performance, identify characteristics that lead to stronger performance than others, the spatial or ecosystems that are more predictable, and temporal forecast validity.
You can view the prototype developed during the meeting HERE and in Figures 1 and 2.
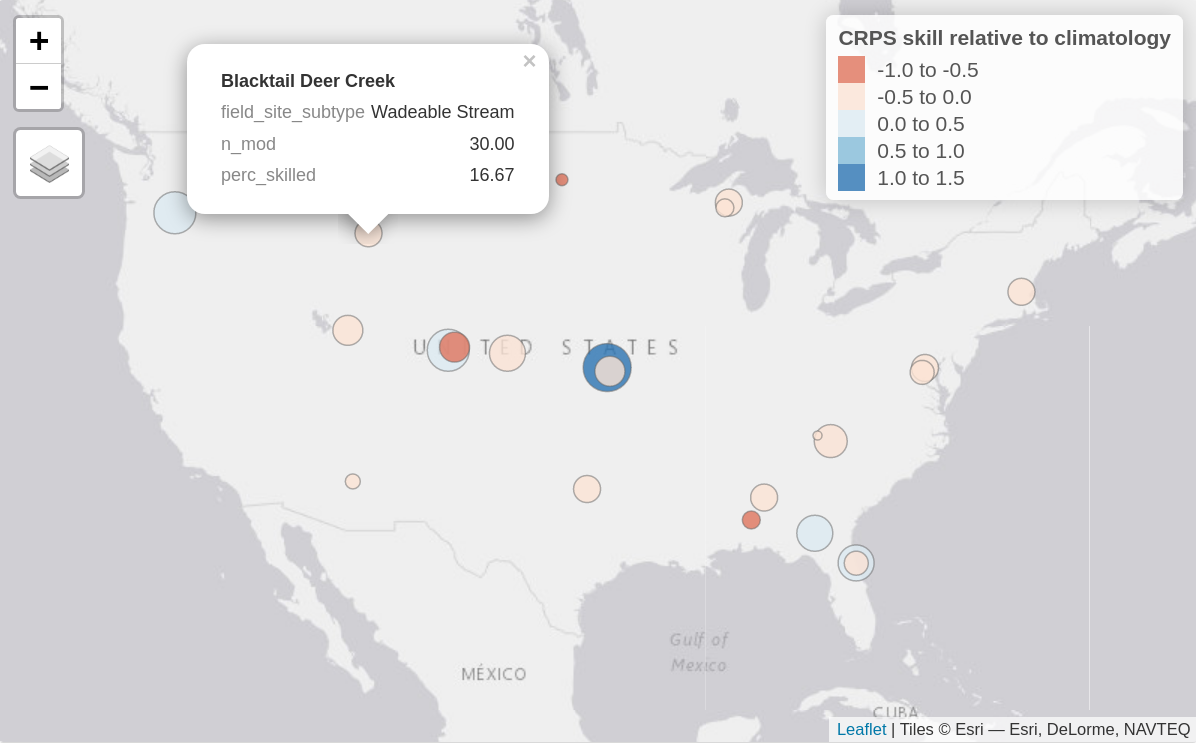
Figure 1. Static image of an interactive map of aggregate forecast skill relative to climatology at each forecasted sites, here showing the water temperature forecasts for the aquatics theme. Bubble colour represents the continuous rank probability score (CRPS) skill relative to climatology with positive values (blues) showing submitted models on average perform better than climatology and negative values showing submitted models perform worse (reds). The size of the bubble represents the percentage of submitted models that outperformed the climatology null (i.e., larger sized bubbles have a higher percentage of skilled models). When hovered over, the bubbles show this percentage (perc_skilled), the site type (field_site_subtype), as well as the total number of models forecasting at that site (n_mod).
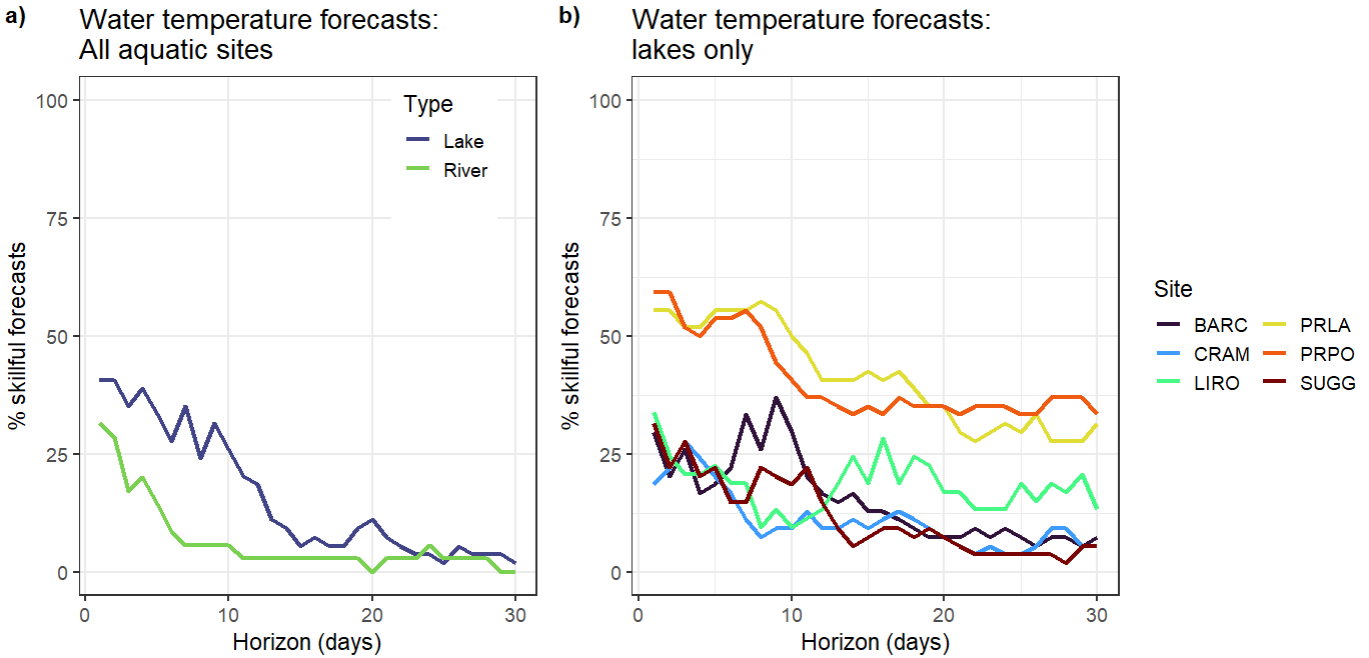
Figure 2. a) Percentage of submitted models that are classed as ‘skillful’ (outperform the null climatology forecast based on the continuous rank probability score metric) at the river (n=27) and lake sites (n=6) for water temperature forecasts at each horizon from 1 to 30 days ahead. b) Percentage of submitted models that are classed as ‘skillful’ for water temperature forecasts at six of the lake sites (https://www.neonscience.org/field-sites/explore-field-sites).
Developing these graphics requires aggregation of skill scores. There are a multitude of metrics that can be used to calculate the skill score, which each have their own benefits and flaws. Thus, there should be multiple skill scores for different metrics with clear presentation of what metric is used at a given visualization. Additionally, in order to isolate what sites are more interesting from a model development perspective, there needs to be a comparison of how many of the models meet a baseline skill score at a given site at a chosen time frame. That allows isolating challenge areas and also easily informs which models really succeed at situations where others struggle. For better future analysis of how models perform at certain sites, we also envisage the visualization to include the skill scores for the relevant drivers (NOAA weather) for comparison. For example, if we see a drop in skill across models in water temperature projections after some time, there should be a direct method to assess if this reflects overall flawed model dynamics or if the weather forecast driving the water temperature loses its reliability. This also allows the user to approximate a maximum length in which the model performance analysis is at all useful.
In addition to the main synthesis overview, the goal of this platform is to support exploration of synthesis data. For all themes, there was general agreement that it would be useful to pull up at a glance, site characteristics, a photo, and basic summary statistics about the number of models and model performance.
During the meeting, we worked with the Aquatics and Beetles Challenge teams to identify some of the key data aggregation groupings that will be important to facilitate exploration. One important distinction arose during the conversations – the baseline model, time scale, and data latency. For Aquatics there is a long time series of data that create a climatology and data are provided relatively quickly via data loggers. For Beetles, there is a different null baseline model given the length of historic data that is different at each site and it takes a year to provide beetle abundance and richness assessment. There was also a desire to have specific types of synthesis visualizations including the species accumulation curve over years, 3-year running average, and indicating the lower and upper bounds of a particular variable (use in scale). Thus, for both Beetles and Aquatics there are similarities and differences in the types of groupings that would be most useful to support synthesis exploration.
Table 1. Different data groupings that would be useful to facilitate easy-to-develop synthesis visualizations of the EFI-NEON Forecast Challenge models to facilitate learning and community theory development.
| Groupings | All Themes | Aquatics | Beetles |
| Team / Challenge | theme, site, model ID, customized classroom or team groupings | particular variables (e.g., DO) within a theme | |
| Spatial / Ecosystems | sites, NEON domains, site type (river, stream, lake…), altitude (high vs lowlands) | sites by distance, dominant NLCD classification | |
| Temporal Scale | average for past year, seasonal groupings, | 1 day, 5 days, 7 days, 15 days, 30 days | 14 days, growing season, multi-year (up to 5 year) forecasts |
| Models | best model at each site, model inputs, model structure, functional type, output uncertainty representation | model run time, model computational requirements | |
| Skill Scoring | current skill forecast approaches, better than climatology/null baseline, | comparison of your model to the best forecast | |
| Other Features | environmental variables and weather forecast observations | comparison with weather/climate forecast skill | disturbance events (e.g., widlfire), growing season dates at each sites, site disturbance characteristics (e.g., mowing, fencing) |
In addition to the synthesis overview, there were two complementary and linked platforms that will create the dashboard. First, the objective of the forecast challenge overview is to provide a basic summary of metrics related to the overall EFI NEON Ecological Forecasting Challenge. Specifically, the metrics that would be included are: number of forecasts submitted, number of unique teams, percentage (or median of all) of models that are better than climatology or a null model per theme, and total forecast and observation pairs.
Second, the objective of the self-diagnositic platform is to provide an overview for individuals or team forecast contributions and performance. The types of summaries that will be provided for the forecasters are: confirmation of forecast submission, date of the most recent forecast submitted for a model, model performance relative to climatology or null model, model prediction versus observation, model performance vs other selected models, and model skill over a specific time horizon (to assess whether it performs better over time).
Overall, the goal of the re-envisioned visual dashboard is to create platforms that will allow us to track challenge engagement, individually or as a team diagnose any model submission problems and performance improvement opportunities, and support community theory development through a synthesis given the range of models submitted through the EFI NEON Ecological Forecasting Challenge. Long-term, if this platform structure is useful and robust, it could be applied to other systems where there are multi-model predictions and there is a desire to collaboratively learn together to improve our theoretical understanding and forecasts to support decision-making.
We are looking for input from the EFI community on the synthesis dashboard for other themes, to discuss with individuals what synthesis would be most relevant to phenology, terrestrial, and ticks forecasters. Reach out to info@ecoforecast.org to share your thoughts or let us know you would like to join future conversations about updating the dashboard.