June 2, 2025
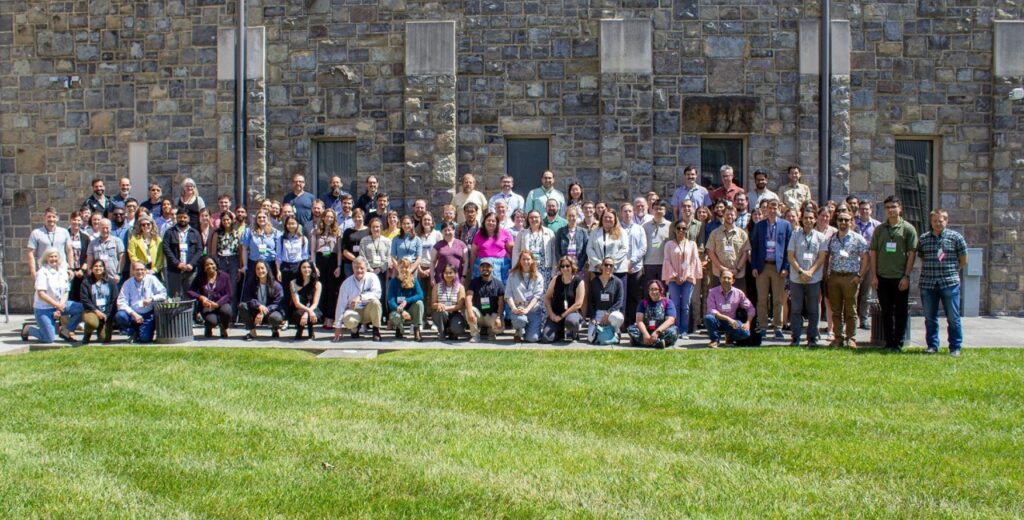
The Ecological Forecasting Initiative (EFI) convened its annual conference at Virginia Tech in Blacksburg, Virginia from May 19-22, 2025. Hosted by the NSF-funded EFI Research Coordination Network and the Virginia Tech Center for Ecosystem Forecasting, the event brought together over 100 scientists, practitioners, and decision-makers from academia, government, industry, and non-profit sectors to advance the field of ecological forecasting. Many attended an EFI conference for the first time.
🌱 Advancing Ecological Forecasting
The conference featured a dynamic program that included:
- Keynote addresses by Mark Urban (University of Connecticut), Antoinette Abeyta (University of New Mexico Gallup), and Kate Thibault (National Ecological Observatory Network; NEON), who provided insights into the the future of ecological forecasting, the need and ways to build accessible pathways to data science and forecasting accessible, and the reciprocal influence of NEON and EFI to empower ecological forecasting and improve usability of NEON resources.
- Oral sessions and poster presentations covering a wide range of topics, including decision-making processes, forecasts in terrestrial, freshwater, and marine ecosystems, and for biodiversity conservation. Statistical, artificial Intelligence, and computational methodologies were highlighted, and forecasts presented ranged from early in development to operational.
- Workshops and Working Groups that facilitated knowledge exchange, skill-building, and project development among participants.
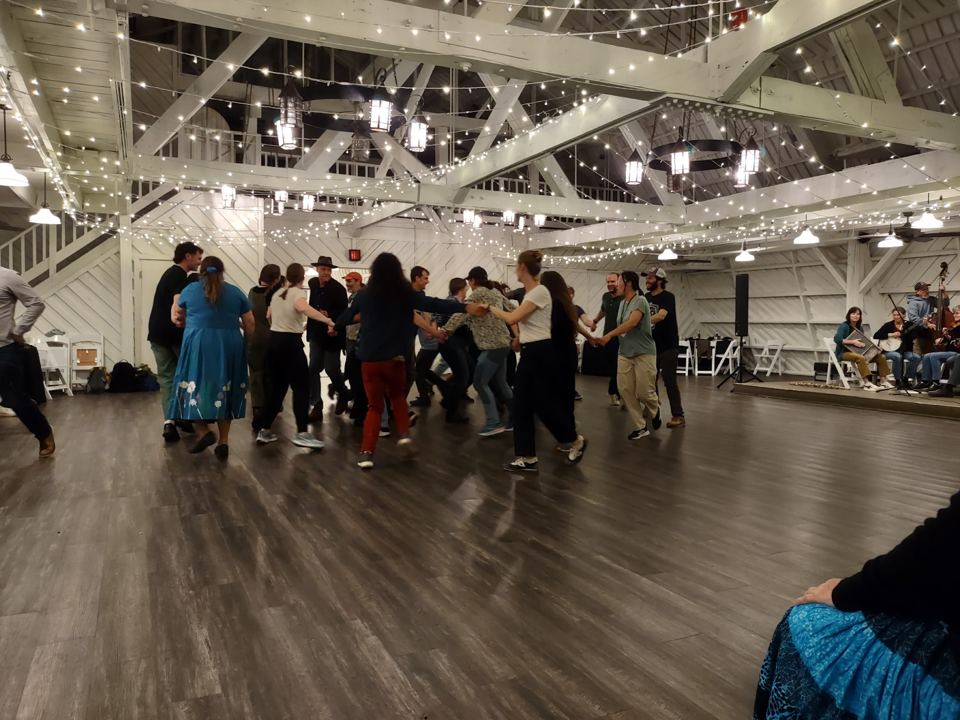
- Field trip and cultural event in the mountains of Virginia. Participants visited Mountain Lake Biological Station (MLBS), providing attendees with a firsthand experience of the MLBS NEON site. Multiple hikes near the iconic Mountain Lake Lodge, where Dirty Dancing was filmed, provided time for networking. The field trip wrapped up with getting the group on the dance floor to learn how to Appalachian square dance, two-step, and waltz, complete with a caller and live band.
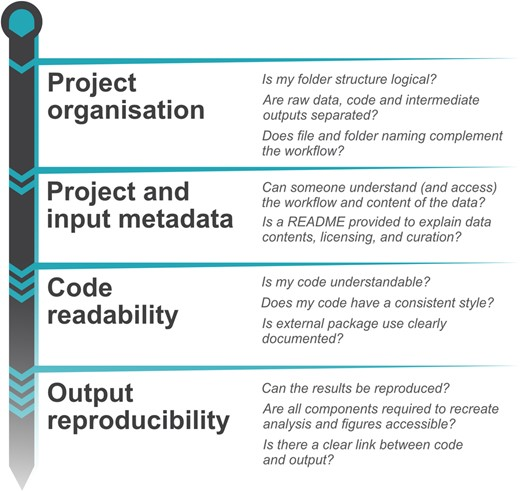
🛠️ Building Capacity for the Future
A highlight of the conference was the emphasis on capacity-building through:
- The EFI Futures Outstanding Student Presentation Award recognizes exceptional student contributions and fosters the next generation of ecological forecasters. Congratulations to Charlotte Malmborg (Boston University), whose talk on “Towards Forecasting Recovery After Disturbance: A Case Study and Potential Directions for Forest Management” won best oral presentation, and Parul Vijay Patil (Virginia Tech), who won best poster for work on “Gaussian Process Forecasting of Tick Population Dynamics.” Find more information about their presentations here.
- Working group activities allowed subsets of participants to dive into four topics and brainstorm opportunities for further EFI activities to advance ideas for those topics. Here are short summaries from each working group.
1. Predictability of Nature developed the foundations for a conceptual synthesis manuscript about how forecasts build on and contribute to an interdisciplinary conceptualization of ecological predictability. The group brainstormed hypotheses about predictability, then identified opportunities, challenges, and data gaps to assess those hypotheses across multiple scales.
2. Topical Discussion of NEON shared information about the tiers of code resources, openly available on NEON’s code-hub (https://www.neonscience.org/resources/code-hub), and NEON data tutorials available for classroom and self-paced online learning (https://www.neonscience.org/resources/learning-hub/tutorials). NEON also provides research support services to share what resources are available and what is feasible to do related to the proposed research project, and help put together a budget for using NEON resources. Find more details and how to connect at: https://www.neonscience.org/resources/research-support.
3. EFI University for Everyone collaboratively redefined and reimagined what an inclusive educational community in ecological forecasting might look like, including the different components of data science and ecology curriculum, and community-based efforts to create resources that can be shared with the EFI community. The group identified three activities participants were most interested in developing, including 1) agreeing on standards for open educational resources that takes into account limited internet and software access and inventorying existing resources, 2) developing a mentorship model that could be incorporated into future EFI activities, and 3) assessing current resources that could be used or modified for use by EFI members in current connections they have with existing community activities (e.g., summer camps or programs) targeting the K-12 level.
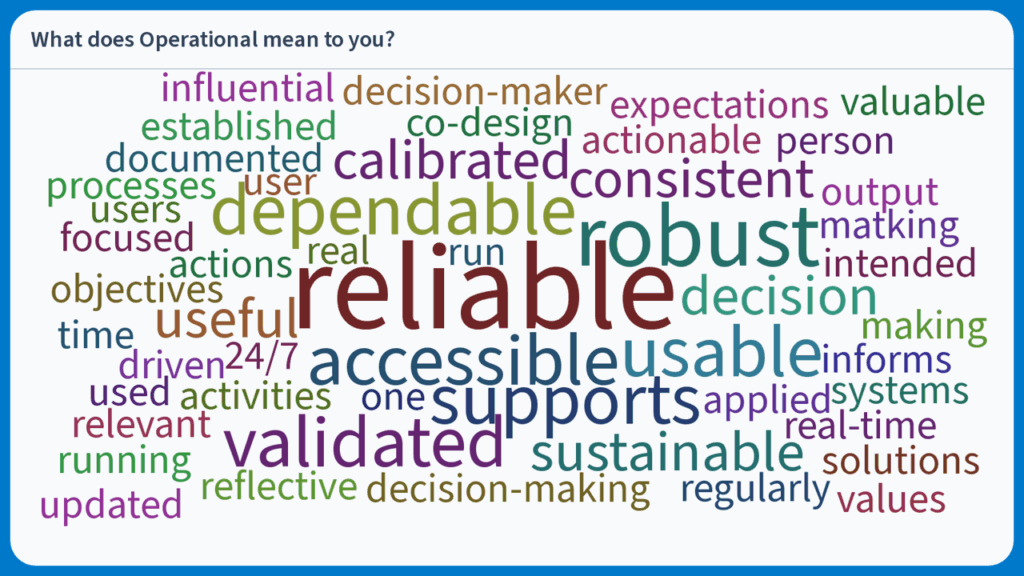
4. Research to Operations, Applications, & Commercialization (R2X) fostered lively and thoughtful discussion among participants to address challenges and opportunities in transitioning ecological forecasts from research to products and projects beneficial to society as a whole. Participants included representatives from numerous groups who provided a variety of perspectives. Government agency personnel who could not travel to attend the meeting in person joined remotely to share examples of operational forecasts and barriers to operationalizing forecasts. The perspectives will form the foundation for a future workshop focused on advancing R2X pathways for the EFI community. The word cloud below is an example of what “operational” meant to the participants of the Thursday session.
- Training workshops enhanced participants’ skills in model development, data analysis, and stakeholder engagement. Here are links to resources from the eight workshops.
1. Create and automate real-time water quality forecasts
Leads: Mary Lofton, Freya Olsson, Austin Delany, Adrienne Breef-Pilz, Rohit Shukla, Quinn Thomas, Cayelan Carey
Virginia Tech
Participants in this workshop created, submitted, and automated real-time forecasts for up to 40 freshwater physical, chemical, and biological variables in the Virginia Ecoforecast Reservoir Analysis (VERA) forecasting challenge.
● VERA forecast challenge website: https://www.ltreb-reservoirs.org/vera4cast/
● VERA forecast tutorial in R: https://github.com/LTREB-reservoirs/vera4cast-example
● VERA forecast tutorial in Python: https://github.com/LTREB-reservoirs/PY-VERA_EXAMPLE
2. Spatial forecast of post fire recovery using MODIS LAI
Leads: Steven Hammond1, David Durden2, Chris Jones3, John Smith1
1Montana State University, 2NEON, 3NC State University Center for Geospatial Analytics
Participants learned about creating a spatial forecast and how that differs from other non-spatial NEON forecast challenges. Forecasting wildfire recovery using MODIS LAI was used in this example.
● Find the tutorial material at: https://github.com/eco4cast/modis-lai-forecast/tree/main/tutorials
● See the rendered html at: https://htmlpreview.github.io/?https://github.com/eco4cast/modis-lai-forecast/blob/main/tutorials/efi_2025_workshop.html
3. Hands-on introduction to the Beetle Communities NEON Ecological Forecasting Challenge
Leads: Eric Sokol, Vicky Louangaphay
NEON
This workshop provided code-along instructions to submit forecasts for ground beetle abundance and richness across NEON’s terrestrial sites to provide a hands-on demonstration of how to participate in the NEON Forecasting Challenge.
● https://www.neonscience.org/resources/learning-hub/tutorials/neon-beetle-forecasting
4. Introduction to Gaussian Process Modeling of time dependent ecological data in R
Leads: Leah Johnson, Robert Gramacy, Parul Patil
Virginia Tech
This workshop introduced Gaussian Process (GP) modeling for forecasting time dependent ecological data and demonstrate applications to tick abundance in the NEON Forecasting Challenge.
● Find workshop details, slides, and a tutorial at: https://lrjohnson0.github.io/QEDLab/training/EFI2025.html
5. Water Quality Modeling: Building aquatic ecosystem models with the modular AED framework
Lead: Matthew Hipsey
The University of Western Australia
This workshop provided hands-on training in the simulation of aquatic ecosystem processes using the open-source Aquatic Ecosystem Dynamics (AED) platform.
● Find workshop materials at: https://github.com/AquaticEcoDynamics/efi-workshop
6. Accessing and Using NEON Data
Leads: Eric Sokol, David Durden, Vicky Louangaphay
NEON
This workshop included an overview of NEON data and how to use the Data Portal and the neonUtilities R package to access and work with selected datasets.
● Slides and notes from the workshop
7. Hands-on Introduction to Cloud-native, Event-driven Computing in R with FaaSr
Lead: Renato Figueiredo, Ashish Ramrakhiani
Oregon State University
Participants in this workshop gained hands-on experience installing and running an example ecological forecasting workflow using FaaSr, an R package with cloud-native functions and workflows that execute on-demand.
● Find workshop materials at: https://github.com/Ashish-Ramrakhiani/FaaSr_workshop
8. Evaluation, scoring, and synthesis of ecological forecasts using the NEON Forecasting Challenge Catalogue
Leads: Freya Olsson1, Caleb Robbins2, Quinn Thomas1
1Virginia Tech, 2Baylor University
This workshop introduced concepts and tools for forecast evaluation, scoring, and synthesis. Participants used the vast, open, catalogue of forecasts submitted to the EFI-NEON Forecasting Challenge to apply the tools for forecast evaluation and comparison.
● Find workshop materials at: https://github.com/OlssonF/Forecast-evaluation-EFI25
🌍 A Global Community Committed to Ecological Forecasting
With over 100 attendees from 5 countries, almost half graduate students or postdocs and a third mid- to late-career stage, the EFI 2025 Conference underscored the importance of collaboration across disciplines and sectors to address complex ecological challenges. By fostering an inclusive and innovative environment, the conference contributed to the advancement of ecological forecasting as a vital tool for understanding, managing, and conserving ecosystems.
See more information about the conference, at: https://bit.ly/efi2025