
April 6, 2022
Fullscreen ModeAuthor Archives: Jody Peters
EFI Newsletter Issue 22 – Special Election Edition
EFI Newsletter Issue 21
EFI Newsletter Issue 20
December 7, 2021
Serious Fun: Reimagining Virtual Events Recap
December 2, 2021
Post by Jody Peters
The EFI Partner’s Working Group hosted Pablo Suarez on November 19 for an intensely participatory Zoom call session titled “Serious Fun: Reimagining Virtual Events on Ecological Forecasting”. This was the first of a 2-part series on science communication. The second session, “Sharing is Caring: Communicating Science Beyond Academic Publications” will be held on January 19. You can find details and register for the January session here.
The first session on November 19 was not recorded due to the intensely participatory nature of the call. However, below we share an overview of the call and resources shared by Pablo.
Pablo Suarez is innovation lead at the Red Cross Red Crescent Climate Centre, a visiting fellow at Boston University, and an artist in residence at the National University of Singapore. He directs the Climate Centre’s initiatives linking applied knowledge with humanitarian work, as well as new approaches to climate risk management. Examples of his work include participatory games for learning about climate change and dialogue, and forecast-based financing pilots in Togo and Uganda.
Pablo started with the premise that disasters are collaborating better than humans are – for example, things like the pandemic, climate issues, and conflicts are exponentially causing harm and we need to have better collaborations between those who know and those who do. And if we want to effectively work with other scientists, people impacted by what we study, or policymakers, we need to let people know how much we care about what they care about. Often we convey information and work to develop collaborations through meetings and presentations typically with a keynote or series of talks followed by a short Q&A session. Pablo advocated that there are better ways to communicate and develop collaborations during meetings and conferences and that is by using games and including humor and spontaneity as a way to broaden engagement and make connections.
As I worked with Pablo to coordinate the logistics for the call and compile the advertising material, I didn’t grasp what the “Serious Fun” part of his talk title meant. But after participating on the call, I am inspired to think about ways to incorporate his suggestions for reimagining virtual events which are low-carbon and low-budget compared to in-person events. We know Zoom fatigue is real, but by including spontaneity, humor, and games, virtual events can be more engaging and can lead to deepened networks and collective action. By having fun, we can be more effective at conveying serious ideas about science, ecological forecasting, and making decisions.
Below I describe the two major activities held during the call and end with a list of the resources Pablo shared.
1. Rant
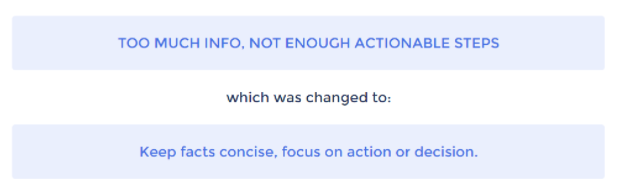
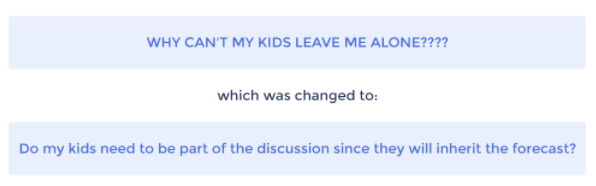
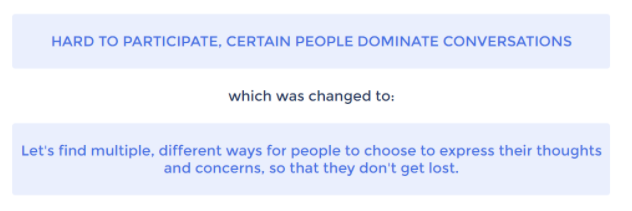
One group activity was called Rant. Early on in the call, we had a short amount of time to write out all our frustrations with Zoom calls. It was fast-paced and Pablo really encouraged us to get into the Rant by expressing our frustrations through things like capitalization, exclamation marks, etc. Later after other activities in the call, we had the opportunity to go back to rants submitted by ourselves and by others on the call to think about changes that could be made to alleviate issues with Zoom calls. You can see a few example rants and changes below and you can find all the rants here. I particularly appreciated the second example below, since that was my rant.
2. Decisions for Seasons
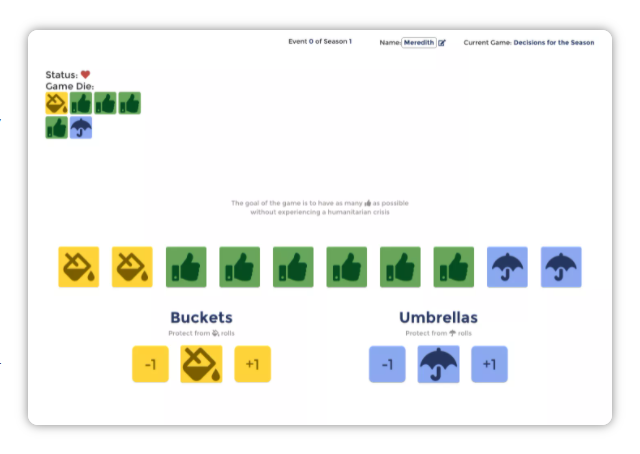
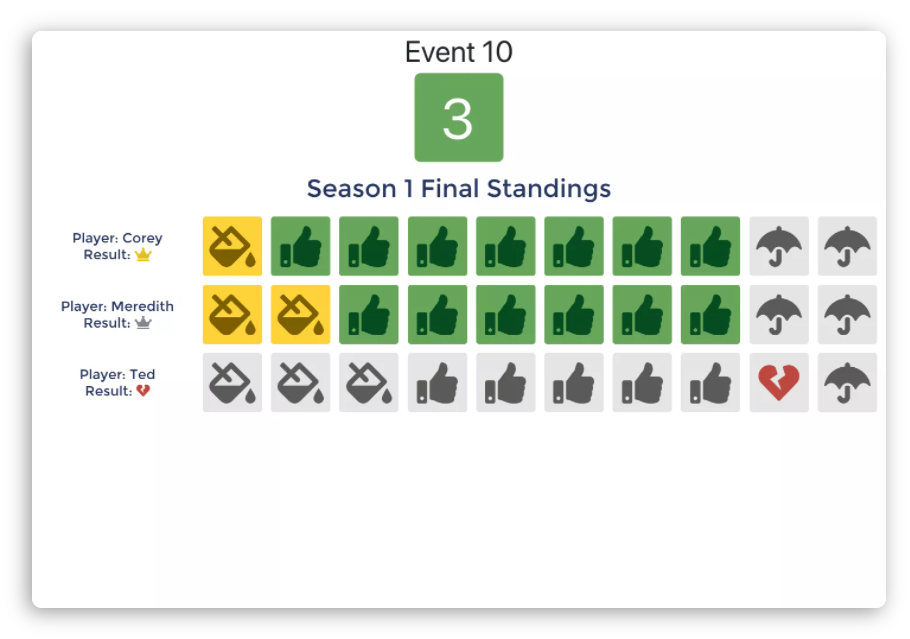
The other major activity Pablo facilitated was a version of Decisions for Seasons, a game designed to support learning and dialogue about key aspects of planning for extremes and experiencing climate change impacts and managing risk. In this game, everyone had 10 forecasts about the climate conditions for the next year. We could choose if the conditions would be regular/normal (thumbs up) or if we should plan for drought insurance (buckets) or flood insurance (umbrellas). This game was also fast-paced with only about a minute to make these decisions. After everyone had made their predictions about the future conditions, Pablo rolled a die where a 1 meant there was a drought and a 6 meant there was a flood and we all hoped we had picked enough drought or flood insurance to handle those rolls! The fun part was then seeing whose predictions were correct and who ended up getting broken hearts for incorrect predictions (see the second image below). Although we didn’t have time during our call, an extension to this game is to incorporate climate change by using an 8-sided die where floods become represented by a 6, 7, or 8 increasing the chance of an extreme event. You can find more details about how this game can be played here.
Throughout the call we had fun, there were moments of heart-racing tension to get our predictions and answers in, there were opportunities for competition and collaboration, and plenty of joy. But there was also a seriousness moving forward to think about what we are doing with forecasts, how we can improve forecasts, how we can improve people’s access, understanding, and opportunity to act, and how we can enable people to make decisions with forecasts.
While this seminar focused on how to make virtual events more engaging, Pablo’s suggestions and resources can also be applied to in-person conferences and meetings, classes, and lab meetings. Let’s have more fun, let’s be more engaged!
Resources
For those interested in exploring how to incorporate games into your presentations and to find ways to make your audiences know you care about what they care about, the following are resources Pablo shared during the call.
- The Climate Centre’s website has lots of resources (climatecentre.org). In particular, there is a section about humour and a number of climate games.
- There are almost 30 climate games applicable for small to large groups (n=6-100) and that cover a range of topics including climate change adaptation and mitigation, collaboration, disaster risk reduction, health, resilience, etc. Each game includes learning objectives, intended audiences, required materials, and pdf and video tutorials. A number of the games specifically connect to forecasting and decision making incuding the Decisions for Seasons game we played during the call. Two other examples include
- Before the Storm – a decision-making game designed to introduce weather forecasts and possible actions to take against natural disasters through different roles.
- Paying for Predictions – a participatory activity to experience the impacts of climate change, to understand the value of forecasts and to enhance the understanding of climate smart disaster risk reduction.
- There are almost 30 climate games applicable for small to large groups (n=6-100) and that cover a range of topics including climate change adaptation and mitigation, collaboration, disaster risk reduction, health, resilience, etc. Each game includes learning objectives, intended audiences, required materials, and pdf and video tutorials. A number of the games specifically connect to forecasting and decision making incuding the Decisions for Seasons game we played during the call. Two other examples include
- Pablo used the GoodGames platform during our call for the Rant and Decisions for the Season activities. The Decisions for the Season can be played in person with the instructions linked on the Climate Centre’s website, but GoodGames has also made an online version here. You can learn more about GoodGames here: https://gg.goodfocus.net/about/. The games do cost money, but if this was something you or your organization were interested in, it would be worth checking in with GoodGames. I believe their are discounts for those in non-profits.
- Pablo shared a 2016 paper he is a co-author on, “Using a Game to Engage Stakeholders in Extreme Event Attribution Science“. You can find his other publications about climate games here.
EFI Newsletter Issue 19
EFI Newsletter Issue 18
The Integration of Ecological Forecasts Into Environmental Policy
Date: July 14, 2021
Post by: Güray Hatipoğlu1, 2Kira Sullivan-Wiley, 3Jaime Ashander
1Middle East Technical University, Earth System Science, Ph.D. Candidate, 2University of Notre Dame, Biological Sciences, Postdoctoral Associate, 3Resources for the Future; SESYNC Affiliate Scholar in Socio-Environmental Systems Modeling
In this series, we are asking: How might ideas from the social sciences improve ecological forecasting? What new opportunities and questions does the emerging interdisciplinary field of ecological forecasting raise for the social sciences? Using social science to understand how and when ecological forecasts are included in environmental policy can improve the ways in which ecological forecasters frame, communicate, and adapt their work.
This installment engages with the relationship between ecological forecasts and environmental policy. The central aim of environmental regulations is to maintain critical services for local populations, including clean air, clean water, and biodiversity. The central aim of ecological forecasting is to predict future conditions under a particular set of circumstances, including policy and regulatory scenarios.
Because environmental regulation and ecological forecasting are both concerned with future environmental conditions, one might expect to find ecological forecasts included and/or integrated into environmental regulations. In this piece we ask, is this the case?
We identified several operational forecasts that are either currently used or mandated for future use by national or international regulations and treaties. These include a decision support system in the Baltic Sea, a harmful algal bloom monitoring system in the Republic of Korea, and a system for pest forecasting in Latvia. In this blog post, we trace each system from inception to operation to give insight into how ecological forecasts can be integrated into legislation and action.
An increasing problem in the Baltic Sea is widespread eutrophication. This issue, and the associated reduced fish stocks resulted in the creation of HELCOM, the Helsinki Commission, a multilateral decision making body for all states having a coast on the Baltic Sea. At first, HELCOM relied on close monitoring and measurements taken by individual states to address eutrophication. Over time, policies and binding rules were developed by HELCOM, but with incomplete scientific understanding of the complicated ecosystem dynamics of the Baltic Sea. Ultimately, HELCOM realized the utility and significance of an international independent scientific organization, to maintain a database where each state would report its pollutant loads and other relevant information. Moreover, HELCOM instituted a requirement of modeling ecosystem dynamics to generate both environmentally sound and economically feasible plans. In 1999, it initiated MARE (Marine Research on Eutrophication) to construct a user-friendly decision support system, NEST, for the Baltic Sea that is based on, inter alia, ecological models. NEST’s outputs were considered to be the “best available scientific information” in the 2007 HELCOM Baltic Sea Action Plan. The Plan explicitly incorporates NEST outputs into decisions made to control eutrophication. The NEST is still operational and can be used by anyone freely (scroll to the bottom of this webpage to find details about the different versions of NEST and how to download the tool).
In addition to the direct use of forecasts by government decision makers, there are also instances of the government supporting ecological forecasts intended for the public, akin to daily weather forecasts. The National Institute of Fisheries Science of the Ministry of Oceans and Fisheries of the Republic of Korea actively monitors harmful algal blooms in its country’s coastal areas and issues forecast alarms regarding its spread. This system, Red Tide Control Room, developed after dramatic fish losses owing to the harmful algal blooms, with their forecasts widely broadcasted to everyone that might be affected.
Another example is Latvia’s Plant Protection Center’s (PPC) and its use of RIMPro forecasts to aid in responsible use of pesticides. RIMPro is a forecasting tool initially developed to forecast apple pests (though it has diversified since) and is intended to inform growers’ decisions on the use of pesticides on apple trees. This particular product was chosen by PPC after substantial research, a growing body of knowledge including from the local people, and comparisons with several other available forecasting tools. The Plant Protection Center has been working for more than a hundred years and has historically collaborated directly with governmental bodies on preparing legislation. The institute’s recently separated research arm (Agrihorst) conducts state-sanctioned monitoring and research on pest management and broadcasts RIMPro forecasts, normally a commercial product, on their websites freely for regions of Latvia.
In these examples, ecological forecasts of complicated ecological phenomena — MARE NEST for eutrophication in the Baltic Sea, the Republic of Korea’s Red Tide Control Room for harmful algal blooms, RIMPro for pests in Latvia — are incorporated directly and formally into environmental decisions. These examples indicate that the widespread use of ecological forecasts may depend not only on their predictive power but also on how they are integrated and recognized in formal decision processes. Experience and social science research suggest alignment of stakeholder goals and co-production with stakeholders are two necessary components to achieve this tight integration. Use of this and other knowledge from decision sciences or organizational sciences can help to develop forecasts that are fit for purpose.