January 27, 2021
In this installment of our ongoing “Forecast Spotlights” series, we highlight the USA National Phenology Network (USA NPN) whose mission is to collect, organize, and share phenological data and information to aid decision-making, scientific discovery, and a broader understanding of phenology from a diversity of perspectives. Responses to the questions below were provided by Theresa Crimmins, USA NPN Director and Research Professor in the School of Natural Resources and the Environment at the University of Arizona. The USA NPN is also an EFI Partner Organization and is a partner on and participating in the design of the EFI RCN NEON Phenology Forecast Challenge which will start accepting forecasts on February 1, 2021.
1. How did you get interested in ecological forecasting?
The business of USA National Phenology Network is to document when seasonal events in plants and animals occur – both historically, in real-time, and in the future. Forecasts are a natural activity for our organization, as advance warning of when various seasonal events will occur is valuable in a wide range of applications including natural resource management, human health, tourism, and agriculture.
2. What are you trying to forecast?
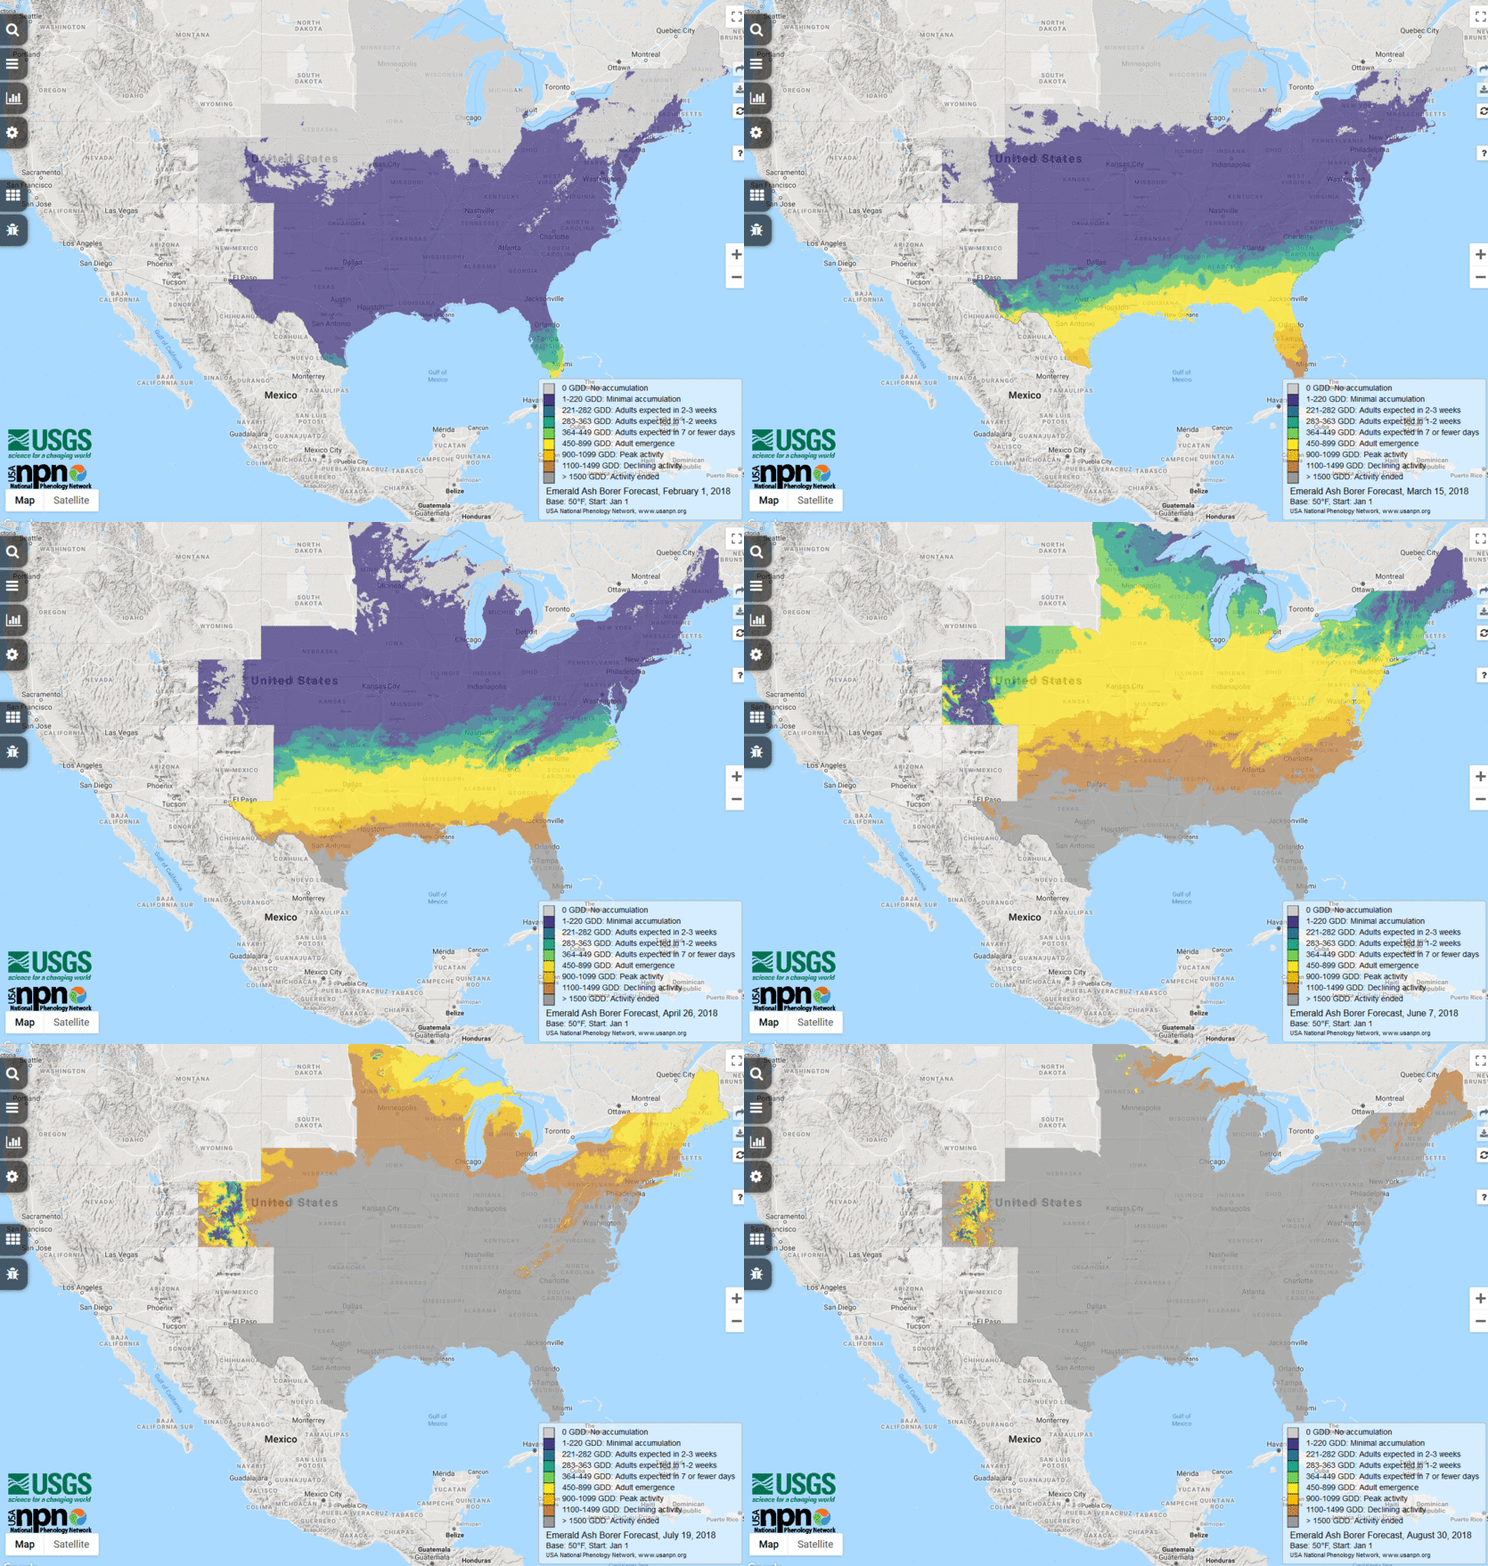
Our aim is to offer forecasts of management-relevant seasonal phenomena to support effectively timing management activities. So far, this includes forecasts of the start of springtime biological activity, key life cycle events in several insect pests, and green-up in the invasive plant, buffelgrass. In spring 2020, we launched a forecast of winter wheat development to support identification of potential damage following freeze events. In 2021, we plan to add forecasts of flowering and fruiting in additional invasive grasses to support management activities. We continue to engage with various manager and researcher communities to identify other important phenological transitions for which forecasts can improve efficacy of management actions.
3. Who are the potential users or stakeholders for the forecasts you create?
Forecast users include land managers, arborists and tree care specialists, invasive species eradication groups, and conservation practitioners as a part of planning and carrying out management activities. In addition, the forecasts – the start of spring forecast in particular – are heavily referenced by the news media as spring is progressing across the country.
4. What are the key lessons you have learned from your forecasts?
Predictions of when an event such as leaf-out or green-up will occur are limited both by the input data used in the forecasts and the models. We have experienced limited forecast performance as a result of both coarse input data and simple models. We hope to address both of these issues incrementally, experimenting with various sources of input data (gridded and station-based) and increasing the sophistication of our approaches.
In addition, our current forecasts are short-term in nature. In most cases, they are available six days into the future at a specific location, as a result of the short-term availability of the forcing variables, though some further insight can be gained by looking at phenological activity at lower latitudes or elevations, which generally experience activity earlier than higher latitudes and elevations. However, our stakeholders repeatedly have indicated that predictions of when events will occur on the order of several weeks or months in advance would be of greater value and more aligned with their planning windows. This is an active area of research for us, and we are excited to work with the ecological forecasting community to address this significant challenge.
5. What was the biggest or most unexpected challenge you faced while operationalizing your forecast?
Transforming the forecast output into maps that are clear and concise was a greater challenge than we had anticipated. We discovered the importance of a forecast map being able to stand alone, as our maps are frequently circulated in the news media and social media. We ended up spending much more time than we had planned on refining the map legends, titles, and explanatory text. We wanted to include sufficient detail that a sophisticated user could understand what was behind the forecast, but not so much that a casual user would be confused or alienated. We continue to invest surprising amounts of time in product interpretation, communication, and documentation. More details of this refinement process can be found in this People Refining Forecast Visualization EFI blog post.

6. Is there anything else you want to share about your forecast?
We are actively expanding our suite of forecasts on several fronts, and invite collaboration from the broader community. Our current activities include engaging with end-user communities to identify the most useful species and seasonal events to forecast as well as the best ways to deliver this information. We are also actively working to establish predictive models for phenomena where they do not yet exist. Finally, we are expanding our abilities to operationalize more sophisticated models, moving from simple thermal sum models to mechanistic models. We are excited to continue to grow in all of these directions to offer progressively more meaningful predictions of when seasonal events in key plant and animal species are likely to occur.
