Forecast Spotlights – USA National Phenology Network

January 27, 2021

In this installment of our ongoing “Forecast Spotlights” series, we highlight the USA National Phenology Network (USA NPN) whose mission is to collect, organize, and share phenological data and information to aid decision-making, scientific discovery, and a broader understanding of phenology from a diversity of perspectives.  Responses to the questions below were provided by Theresa Crimmins, USA NPN Director and Research Professor in the School of Natural Resources and the Environment at the University of Arizona. The USA NPN is also an EFI Partner Organization and is a partner on and participating in the design of the EFI RCN NEON Phenology Forecast Challenge which will start accepting forecasts on February 1, 2021.

1. How did you get interested in ecological forecasting?

The business of USA National Phenology Network is to document when seasonal events in plants and animals occur – both historically, in real-time, and in the future. Forecasts are a natural activity for our organization, as advance warning of when various seasonal events will occur is valuable in a wide range of applications including natural resource management, human health, tourism, and agriculture. 

2. What are you trying to forecast?

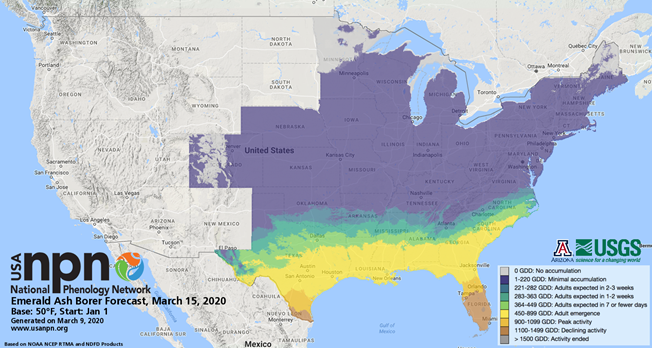
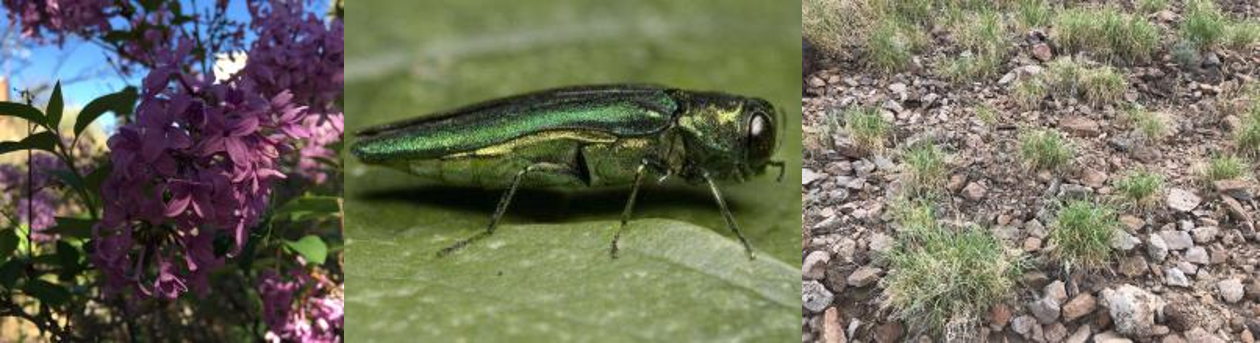
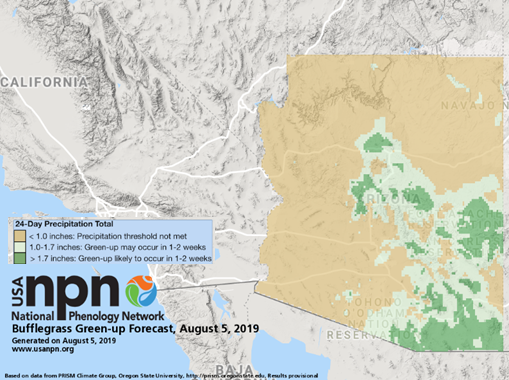
Our aim is to offer forecasts of management-relevant seasonal phenomena to support effectively timing management activities. So far, this includes forecasts of the start of springtime biological activity, key life cycle events in several insect pests, and green-up in the invasive plant, buffelgrass. In spring 2020, we launched a forecast of winter wheat development to support identification of potential damage following freeze events. In 2021, we plan to add forecasts of flowering and fruiting in additional invasive grasses to support management activities. We continue to engage with various manager and researcher communities to identify other important phenological transitions for which forecasts can improve efficacy of management actions. 

Lilacs, Emerald Ash Borer, and Buffelgrass are examples of organisms USA NPN forecasts.

3. Who are the potential users or stakeholders for the forecasts you create?

Forecast users include land managers, arborists and tree care specialists, invasive species eradication groups, and conservation practitioners as a part of planning and carrying out management activities. In addition, the forecasts – the start of spring forecast in particular – are heavily referenced by the news media as spring is progressing across the country.

4. What are the key lessons you have learned from your forecasts?

Predictions of when an event such as leaf-out or green-up will occur are limited both by the input data used in the forecasts and the models. We have experienced limited forecast performance as a result of both coarse input data and simple models. We hope to address both of these issues incrementally, experimenting with various sources of input data (gridded and station-based) and increasing the sophistication of our approaches. 

In addition, our current forecasts are short-term in nature. In most cases, they are available six days into the future at a specific location, as a result of the short-term availability of the forcing variables,  though some further insight can be gained by looking at phenological activity at lower latitudes or elevations, which generally experience activity earlier than higher latitudes and elevations. However, our stakeholders repeatedly have indicated that predictions of when events will occur on the order of several weeks or months in advance would be of greater value and more aligned with their planning windows. This is an active area of research for us, and we are excited to work with the ecological forecasting community to address this significant challenge.

5. What was the biggest or most unexpected challenge you faced while operationalizing your forecast?

Transforming the forecast output into maps that are clear and concise was a greater challenge than we had anticipated. We discovered the importance of a forecast map being able to stand alone, as our maps are frequently circulated in the news media and social media. We ended up spending much more time than we had planned on refining the map legends, titles, and explanatory text. We wanted to include sufficient detail that a sophisticated user could understand what was behind the forecast, but not so much that a casual user would be confused or alienated. We continue to invest surprising amounts of time in product interpretation, communication, and documentation. More details of this refinement process can be found in this People Refining Forecast Visualization EFI blog post.

Animated image for the forecast of the Emerald Ash Borer from February to August, 2018

6. Is there anything else you want to share about your forecast?

We are actively expanding our suite of forecasts on several fronts, and invite collaboration from the broader community. Our current activities include engaging with end-user communities to identify the most useful species and seasonal events to forecast as well as the best ways to deliver this information. We are also actively working to establish predictive models for phenomena where they do not yet exist. Finally, we are expanding our abilities to operationalize more sophisticated models, moving from simple thermal sum models to mechanistic models. We are excited to continue to grow in all of these directions to offer progressively more meaningful predictions of when seasonal events in key plant and animal species are likely to occur.

Forecast Spotlights – Elliott Hazen and Heather Welch

November 23, 2020

In this third installment of our ongoing series, “Forecast Spotlights”, we highlight the EcoCast nowcast and forecasts developed by Elliott Hazen, Heather Welch, and colleagues at the National Oceanic and Atmospheric Administration (NOAA). EcoCast is a fisheries sustainability tool that helps fishers and managers evaluate how to allocate fishing efforts to optimize sustainable harvest of target fish while minimizing bycatch of protected or threatened animals. 

The goal of the Forecast Spotlights blog series is to highlight operational forecasts being conducted by our EFI members, how they got into forecasting, and lessons learned. You can see all the ecological forecast project examples shared on the EFI Projects webpage. If you have an iterative ecological forecast project that you’d like added to this list, you can create a profile for the project using this form.

1. How did you get interested in ecological forecasting?

Elliott: A lot of my interest in ecological forecasting came from my graduate research at Duke University and learning about models forecasting seed dispersal. If such a random-seeming process such as seed dispersal could be modeled successfully it made me wonder what else could be modeled. I ended up using a lot of statistical models in my PhD to deal with the complexities of top predator datasets. In reading about these models, I realized that they could be used not just to understand ecological drivers of animal distribution but also for nowcasting and forecasting distributions moving forward. A paper by Drew Purves titled “Time to model all life on earth” also highlighted the fact that our computing capability has finally caught up to some of the questions that we have been trying to ask ecologically. 

Heather: During my masters at James Cook University I worked with Bob Pressey who was concerned that our global network of MPAs (marine protected areas) was designed to protect static representations of biodiversity, despite common knowledge that many species of management concern have dynamic distributions. We started thinking about how to design management strategies to explicitly accommodate this dynamism. This was a really interesting challenge. At the time there wasn’t much in the literature about how to manage highly mobile species and so there was a lot of room for creativity. It quickly became clear that, in order to manage species that move around, we need to know where species are in real time, or better yet, ahead of time which brought me to ecological forecasting. 

2. What are you trying to forecast?

We try to produce nowcasts and forecasts of the distributions of top predators and human activities to understand and mitigate their interactions, specifically interactions like fisheries bycatch and vessel collisions that put these species at risk. We, specifically Heather Welch in our group, have been predicting fishing behavior to try to identify where and why illegal fishing activities most likely to occur. The models that have predictive skill can be used to direct management and enforcement in the future.

Photo credit: Elliott Hazen

3. Who are the potential users or stakeholders for the forecasts you create?

We target our predictions for use by fishermen and fishery managers in EcoCast, the shipping industry and protected species managers for WhaleWatch, and most recently NOAA’s Office of Law Enforcement and the US Coast Guard for Illegal, Unregulated, and Unreported forecasting efforts. We also usually hope our predictions are interesting if not useful for the broader public.

Real-time predictions for top predators are integrated to produce a surface that indicates areas that are better to fish (blue), and poorer to fish (red) to improve fisheries sustainability. These maps are for the area off the west coast of the US.

4. What are the key lessons you have learned from your forecasts?

  1. We often learn as much from wrong forecasts as right forecasts as it tells us where physical processes may be driving our predictions differently than expected. These outliers can be really useful to understand ecological processes and patterning.
  2. Engaging with stakeholders from the get-go, even before the model is built, is really important to ensure that you’re producing forecasts that are as useful as possible.
  3. Often maintaining and testing ongoing forecasts are as much work if not more work than building the models (Welch et al. 2018). Creating accessible tools collaboratively with stakeholders can ensure the output is as applicable as possible.
  4. Also, Elliott remains interested in comparing the issues and successes in terrestrial vs. marine ecological forecasting systems. While some of the questions being asked are comparable, the processes often change at different scales because of the oceanic medium compared to land and air, which keeps him wondering how the fundamental processes of forecasting may vary across these systems.

5. What was the biggest or most unexpected challenge you faced while operationalizing your forecast?

The biggest challenges in our forecasting process has largely been finding funding and ongoing support for operationalization. Specifically, funding the development of the tools have been manageable but keeping tools working and ensuring predictions remain skillful has been incredibly difficult to fund. This need for ongoing maintenance, often termed research to operations, is a fundamental gap we often face in the forecasting process.

6. Is there anything else you want to share about your forecast?

We have also been moving more and more towards public code libraries to ensure that the lessons we have learned are available to help other forecasting projects get off the ground and also to remain operational. Reproducibility in science has changed as we’ve moved more from bench and field experiments towards modeling efforts. This field, often termed “data carpentry” is going to be growing more and more in the near future to ensure that our coding efforts are done in a publicly available and reproducible manner.

Photo credit: Elliott Hazen

Forecast Spotlights – Elvira de Eyto and team

September 22, 2020

This is the second installment in our ongoing series, “Forecast Spotlights”. The goal of this series is to highlight operational forecasts being conducted by our EFI members, how they got into forecasting, and lessons learned. You can see all the ecological forecast project examples shared on the EFI Projects webpage. If you have an iterative ecological forecast project that you’d like added to this list, you can create a profile for the project using this form.

This post highlights the forecasts developed by Elvira de Eyto and her collaborators, Andew French, Eleanor Jennings, and Tadhg Moore.

1. How did you get interested in ecological forecasting?

It started with the opportunity to do some work on short term (i.e. 5-7 days) forecasting of lake water quality through the PROGNOS project. We have had a high frequency monitoring station on a study lake (Feeagh) for close to 20 years, and we always knew that theoretically, the live data stream could be used to finetune or calibrate lake models at sub-daily time scales. The PROGNOS project funded a PhD student, Tadhg Moore (now completed), to explore this. Building from our experience with PROGNOS, we then moved into the seasonal forecasting domain, and started to adapt workflows for seasonal time scales.

Lough Feeagh AWQMS

2. What are you trying to forecast?

Dr. Andrew French is working on the WATExR project with us, and is building a forecasting workflow coupling seasonal forecasts with fish phenology models. We have a multi-decadal time series of fish movements in and out of the Burrishoole catchment, which Andrew is using to build a set of predictive models driven by meteorological data. The Burrishoole traps capture all seaward migrating Atlantic salmon, sea trout, and European eel.  Understanding and being able to predict the seasonal drivers of these movements is really interesting from a biological and fishery management point of view. It is also a very good test of the current usefulness of seasonal forecasts for phenological models. Andrew and Tadhg are also using the seasonal forecast workflows to predict water levels and availability in the Mount Bold Reservoir in Australia. This is the largest reservoir in Australia, and supplies Adelaide. More info about both these case studies can be found here: https://watexr.eu/case-studies/

European eel

3. Who are the potential users or stakeholders for the forecasts you create?

The water quality and quantity forecasts are targeted at water managers, although they aren’t fully operational – a lot of what we were doing in PROGNOS and subsequently in WATExR was developing workflows which show “proof-of-concept” and highlighted some of the potential pitfall and technical difficulties that need to be overcome. The fish phenology models are targeted at fisheries managers, who may have it within their power to mitigate impacts of e.g. predation, water abstraction, and fishing pressures at key migration times of diadromous fish (i.e. fish that move from freshwater to marine habitats and vice versa). Knowing in advance when to expect these peak migration periods may help to minimise these impacts, and ensure maximum survival at key life stages.

4. What are the key lessons you have learned from your forecasts?

That things get complex really quickly! Also, that unless we think very specifically about uncertainties all along the workflow, the results may be meaningless, so making those uncertainties visible all along the process is really important when communicating the end results. This is particularly true for seasonal forecasting, with end users having very high expectations for what they are going to be able to receive, in terms of model outputs. The reality is that the usefulness of a seasonal forecast is dependent on the variable, geographic location, and season of interest.

5. What was the biggest or most unexpected challenge you faced while operationalizing your forecast?

For the lake water quality forecasts, we realised very early on that we hadn’t put enough thought into incorporating catchment processes in our initial PROGNOS project design, and this required some attention. For the fish phenology models, one of the initial challenges was matching historical fish time series with archived seasonal forecasts (or “re-forecasts”), so that the predictive performance of models could be evaluated – although we had almost 50 years of fish data, the seasonal forecasts didn’t reach back that far. With the release of ECMWF’s ERA5 reanalysis and the SEAS5 seasonal forecasts, we were able to evaluate re-forecasts back to 1993. Fortunately for us, our project partners at Universidad de Cantabria have developed the tools for evaluating seasonal forecasts in their Climate4R R package bundle, which made various technical challenges, such as statistical downscaling, a lot easier than they could have been.

6. Is there anything else you want to share about your forecast?

The fish phenology forecast, which will be submitted for publication shortly, has been developed with data from one small catchment in the west of Ireland.  The next step would be to apply the workflow and methods across the native range of the species involved (the North Atlantic)  to understand whether seasonal forecasts have a role to play in fisheries management over a large geographical range. Incorporating the lessons we have learned into scenarios driven by future climate projections will also be a really exciting prospect, as we seek to mitigate the impacts of climate change on diadromous fish. 

PROGNOS was financed under the ERA-NET WaterWorks2014 Co-funded Call, Water JPI: (IE) EPA (Grant number: 2016-W-MS- 22); (SE) FORMAS; (DK) IFD; (Isreal) MoE-IL; (RO) RCN, with co-funding from the EU Commission. The WATExR project is part of ERA4CS, an ERA-NET initiated by JPI Climate, and funded by MINECO (ES), FORMAS (SE), BMBF (DE), EPA (IE), RCN (NO), and IFD (DK), with co-funding by the European Union (Grant number: 690462).

Forecast Spotlights – Nicholas Record

July 28, 2020

We will be highlighting operational forecasts in conjunction with the release of Newsletters for a new series called “Forecast Spotlight”. The goal is to highlight operational forecasts being conducted by our EFI members, how they got into forecasting, and lessons learned.

The inaugural forecast is ecocaster by Nicholas Record at Bigelow Laboratory for Ocean Sciences. You can also see Nicholas’ ESA 2020 presentation, Using citizen observations to forecast ecosystems from jellyfish to moose to whales, at the EFI watch party on August 4 starting at 1:45pm Eastern Time here: https://youtu.be/42nZ4yAwG1o

1. How did you get interested in ecological forecasting?

I joined a NASA project in the early aughts, funded by their Ecosystem Forecasting program. The goal of the project was to forecast right whale movements to help manage this endangered species. In addition to the value of the project, I was drawn to the interdisciplinary nature of forecasting, including math, biology, and geoscience, as well as the social sciences and visual arts. 

2. What are you trying to forecast?

In my Ocean Forecasting Center, we work on everything from viruses to whales. We try to experiment with new methods as often as we can, embracing the “Cambrian explosion” of forecasting approaches that Payne et al (2017)1 described. At the moment, I’m really interested in using crowd-science approaches to build ecosystem forecasts for human-wildlife interactions. For example, we have real-time forecasts for jellyfish sightings, moose-car interactions, and tick encounters.

3. Who are the potential users or stakeholders for the forecasts you create?

For the crowd-science forecasts, like the jellyfish forecast, the audience is the general public. I need to engage hundreds of people for the forecasts to work, and giving people a daily forecast to look at is a fun way to engage them. For other projects, like our harmful algal bloom forecasts, stakeholders are more specific, including industry members and management agencies. Some of those forecasts are viewable by the public.

4. What are the key lessons you have learned from your forecasts?

If the general public is involved, any barrier to entry (e.g. a webform or login) can result in a major drop in the amount of data that comes in.

The human dimension is just as important a part of the system as the wildlife, environment, etc.

If you want your forecast to be perfect, it might take forever before anyone outside your group ever sees it. Failure is the greatest teacher (I also learned this from Yoda).

5. What was the biggest or most unexpected challenge you faced while operationalizing your forecast?

Data repositories periodically change their data formats or data pipelines. Keeping things automated is constant work.

6. Is there anything else you want to share about your forecast?

Check out some of the experimental crowd-science forecasts at eco.bigelow.org

…And if you have a crowd-sourced forecast idea that you’d like to tinker with, I’d be happy to collaborate.

1 Payne, M.R., A.J. Hobday, B.R. MacKenzie, D. Tommasi, D.P. Dempsey, S.M.M. Fassler, A.C. Haynie, R. Ji, G. Liu, P.D. Lynch, D. Matei, A.K. Miesner, K.E. Mills, K.O. Strand, E. Villarino. 2017. Lessons from the First Generation of Marine Ecological Forecast Products. Frontiers in Marine Science. https://doi.org/10.3389/fmars.2017.00289